Appendix 1 - Size and importance of the digital economy
This appendix sets out background information on what the digital economy is, along with its importance and size in New Zealand and globally.
What is the digital economy?
The digital economy is a term used to refer to economic activity that relies significantly on information and communication technology. The term does not refer to the provision of the information and communications infrastructure itself, but to the economic activities carried on over the top of that infrastructure (and so is sometimes referred to as over the top activities). The term broadly encompasses e-commerce, including the sale of both digital and physical products and services over the internet or via apps, online advertising, social networks, and intermediation platforms (such as Airbnb and Uber).
The OECD has noted that most business models are becoming digitalised to some extent. Consequently, it would be difficult to completely ring-fence the digital economy from the rest of the economy for tax purposes. Following this, some of the analysis and potential solutions have focussed on highly digitalised business models. These business models are typified by the factors that create the most problems for the current international tax framework:
- cross jurisdictional scale without mass;
- heavy reliance on intangible assets; and
- the importance of data and active user participation to value creation.
A DST would only apply to these kinds of business models. However, the OECD is considering proposals that would apply more broadly, including beyond the digital economy altogether.
The importance of the digital economy in New Zealand
The digital economy provides many benefits to New Zealanders. The Ministry of Business, Innovation and Employment (MBIE) estimates that people who shop and bank online can save nearly $1,000 each year. MBIE’s initial calculations suggest achieving universal digital inclusion in New Zealand could deliver economic benefits of over $1 billion a year.[41]
The digital economy also increases the productivity of New Zealand businesses. New Zealand businesses with high intensity information and communications technology use are six percent more likely to improve productivity.[42] Nearly a third of overall industrial output growth in Europe is attributable to the uptake of digital technologies.[43]
Recently the Australian and New Zealand Productivity Commissions issued a report on the digital economy.[44] The report notes that digital technologies have transformed many aspects of daily life, bringing benefits to consumers (more choice, lower prices, better information and greater convenience) and disrupting a number of industries and business models. In fact, given the ubiquitous nature of digital in everyday life, the report notes that there is little to differentiate the digital economy from the broader economy; in other words, the digital economy is the economy. However, digital innovation is putting many regulatory regimes under pressure – including tax.
The report broadly recommends that the Australian and New Zealand Governments create an environment that can enable the growth of the digital economy by:
- designing regulatory regimes to enable innovation while controlling harms;
- using data and digital technologies to improve the efficiency and effectiveness of government services to firms; and
- working together to develop and promote regional and global standards that enable greater use and diffusion of digital technologies.
The Government is committed to developing the digital economy in New Zealand and ensuring access to it for all New Zealanders. The Government’s cross-agency Digital Economy Work Programme aims to support all New Zealanders to fully participate in the fast moving digital economy. However, it is also important that the digital economy is fairly taxed.
The size of the digital economy
Internet usage
Internet usage worldwide is becoming increasingly ubiquitous, as figure 1 from Hootsuite and we are social shows.[45]
Figure 1: Internet usage worldwide
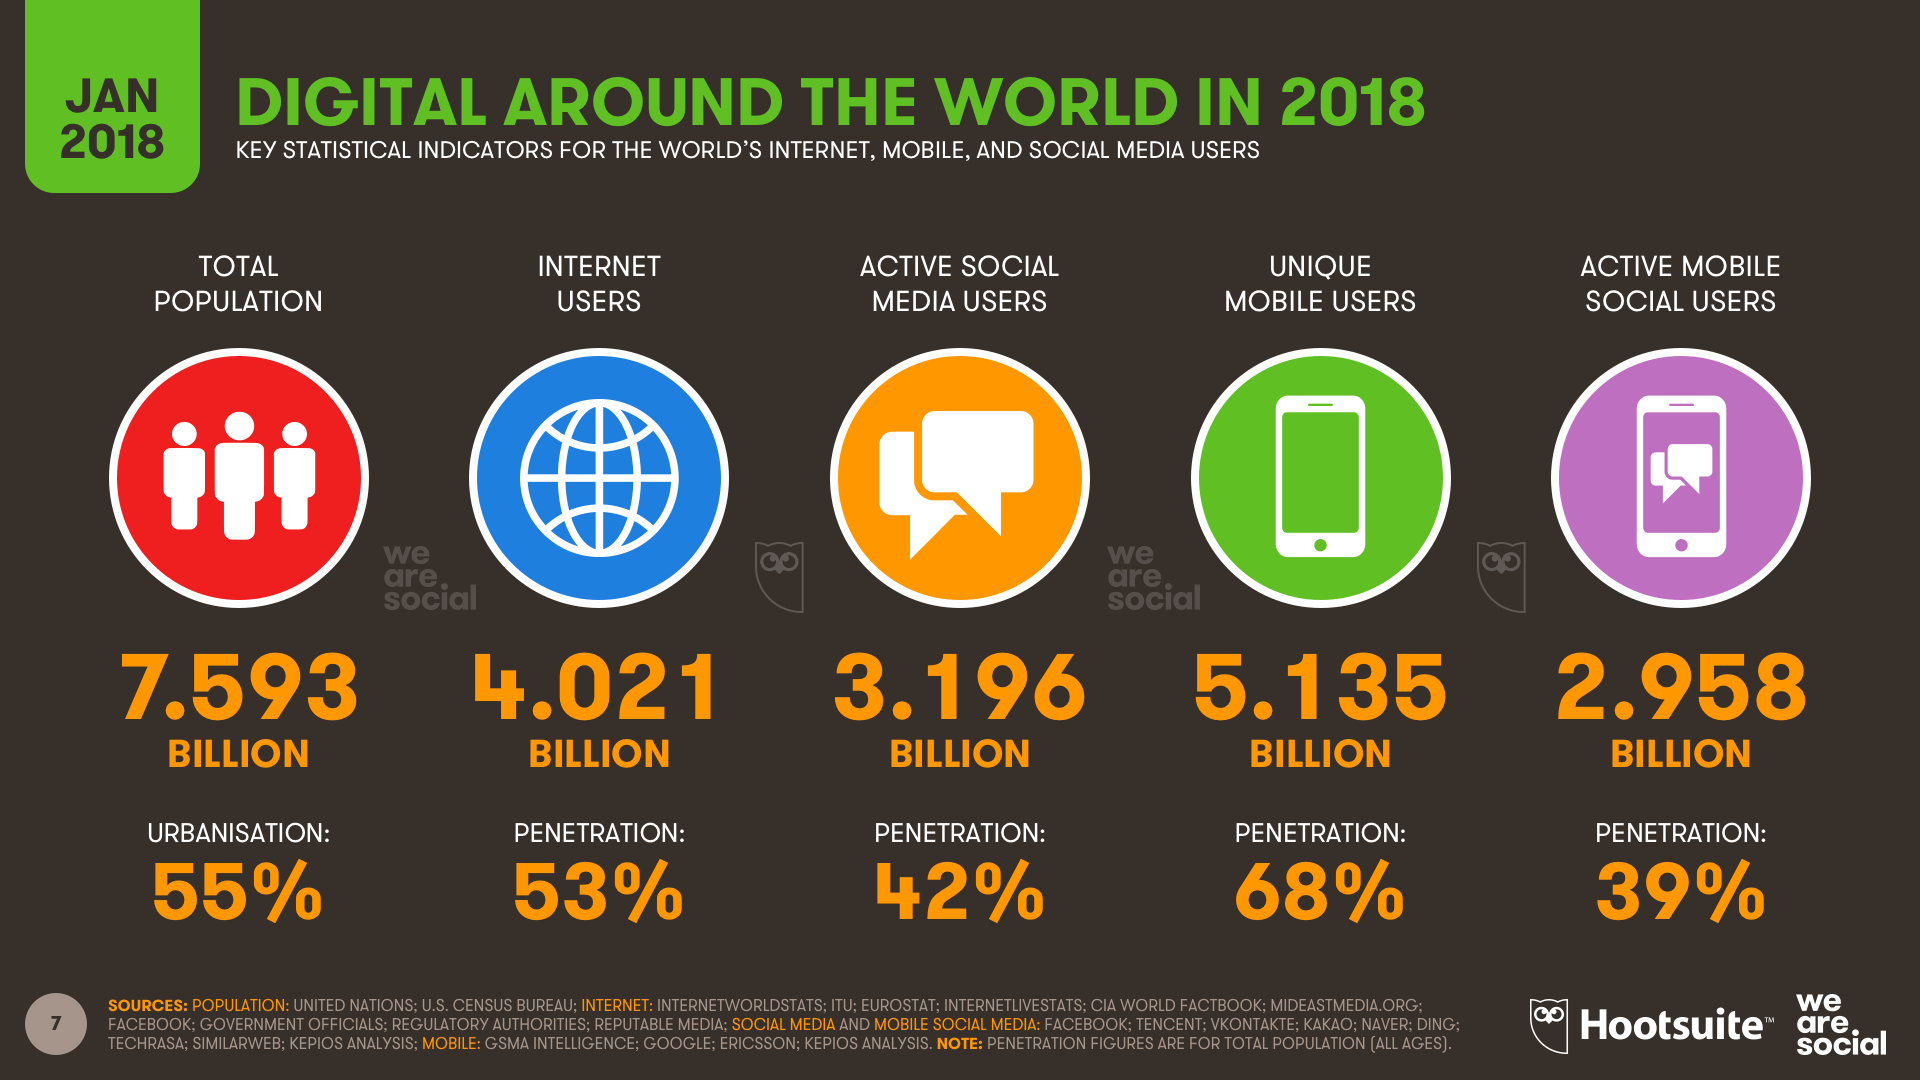
Internet use is also widespread in New Zealand. Currently 93.8% of New Zealanders use the internet, including 97% of New Zealanders under 65. Of these only 9% are classified as being low level users.[46] In addition, two-thirds of New Zealand internet users visit social media every day,[47] with the average time spent per day being 1 hour 53 minutes.[48] MBIE estimates that, of New Zealand’s economically significant firms:[49]
- 100% use the internet;
- 98% have a website;
- 53% use it to make internet sales;
- 44% have internet sales of more than 10% of total sales;
- 62% have sales outside New Zealand;
- 96% use the internet for online ordering; and
- 97% use the internet for finance.
Overall size of the digital economy
The total global ecommerce market was estimated to be worth US$7.7 trillion in 2018[50] (including both the retail and business to business market). The retail ecommerce market (which excludes the business to business transactions) was estimated to be worth US$2.3 trillion in 2017, with a projected rise to nearly US$4.5 trillion by 2021. Figure 2 sets out the anticipated size of the retail ecommerce market, together with its growth rate and share of total retail revenue.
Figure 2: Anticipated size of the retail e-commerce market
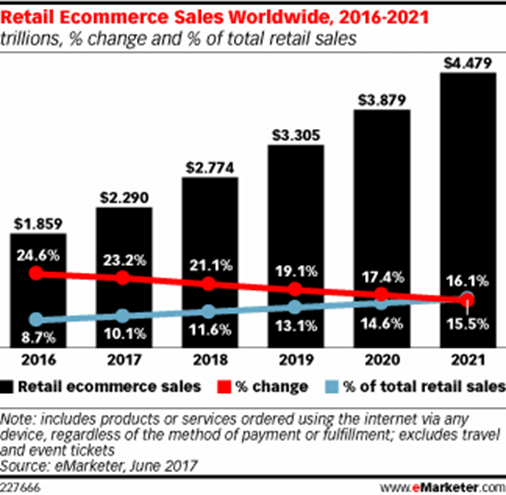
Business to business ecommerce sales are estimated to be worth 2.3 times the total retail sales.[51] This would produce a total estimated ecommerce market of nearly US$10.5 trillion in 2021.
Some figures for Europe show that:
- In 2006 only one tech company was in the top 20, accounting for 7% of market capitalisation. In 2017, nine out of the top 20 were tech companies, accounting for 54% of market capitalisation (out of the top 20).
- Between 2008 and 2016 the revenue of the top five e-commerce retailers grew by 32% a year on average. During the same period, revenue in the entire EU retail sector grew on average by only 1% a year.
- In the last seven years, the average annual revenue growth for the top digital firms was around 14%, compared to 3% for information technology and telecoms firms and only 0.2% for other multinationals.
For New Zealand, the total consumer online shopping expenditure (that is, excluding business-to-business (B2B)) in 2015 was estimated at $4.7 billion (excluding GST). This consisted of $3.5 billion in goods and $1.2 billion on services. Of this, $1.6 billion was spent on goods and $0.5 billion was spent on services supplied from offshore.
Further, online shopping had an average year on year growth rate of eighteen percent up to 2016 (with offshore sales growing faster than domestic).[52] By contrast New Zealand’s general retail market has generally grown from 4–6% each year since 2012 – significantly less than the online market.[53] For 2017, New Zealand Post estimates that the sale of goods online grew at a rate of 13% compared to a growth rate of only 1% for goods sold by bricks and mortar retail. This was made up of a 9% growth in domestic online sales, and a 23% growth in online cross border sales.
Currently ecommerce makes up 8.1% of all retail sale of goods in New Zealand (in China by comparison it is already 23.1%).
We do not have figures for B2B online transactions in New Zealand. However, we can use the existing global estimate that the B2B market is 234% of the B2C market to estimate a B2B online market in New Zealand for 2015 of $11 billion, and a total online market of $15.7 billion in 2015. Approximately $7 billion of this would be paid to offshore suppliers, if they made up the same proportion as they do for B2C supplies. Assuming an 18% growth rate, this would produce a total market of $25.8 billion in 2018, with supplies from offshore worth $11.5 billion and cross border digital services provided to New Zealand consumers, of approximately $2.7 billion in 2018. Given the assumptions required, these figures are unlikely to be very accurate, but they do give a ballpark indication of the size of the digital economy in New Zealand.
Of these figures, the $2.7 billion for cross border services is the most relevant for a proposed DST. This is because the DST would not apply to the supply of goods or most domestically provided e-services (given the nature of e-services provided in New Zealand). Instead it would apply to a subset of the $2.7 billion of cross border services.
Multi-sided platforms and online advertising are particularly important elements of the digital economy for the purpose of this document. This is because a DST would apply to them (subject to de minimis thresholds). Accordingly, we discuss them specifically next.
Intermediation – the sharing and gig economies
An intermediation platform (or a multi-sided platform as it is also called) generally refers to platforms used to facilitate the buying and selling of goods and services between unrelated persons. Digitalisation has allowed people to quickly and relatively cheaply connect and transact on these platforms, including across countries and in an increasing range of areas.
Intermediation platforms form both the sharing economy (which is linked with assets) and the gig economy (which is linked with services). These include travel platforms like Uber, accommodation platforms like Airbnb and peer to peer lending platforms like Harmoney. Increasingly they also allow the self-employed to supply many other types of services to consumers and also businesses, such as house hold repairs and furniture assembly.
Currently the sharing economy makes up a small share of the economy on most estimates. In 2014, the global sharing economy was estimated to be worth US$14 billion. However, it has been growing rapidly and is forecast to increase to US$335 billion by 2025.[54]
Figures from the United States show that transport platforms dominate the sharing and gig economies, both in terms of payments and users. This is followed by asset sharing and selling platforms. Labour supply platforms make up a very small proportion of the sharing economy currently. This is shown in figure 3 prepared by JP Morgan Chase & Co Institute. They examined the proportion of payments into 2.3 million distinct Chase checking accounts from the different kinds of sharing platforms.[55]
Figure 3
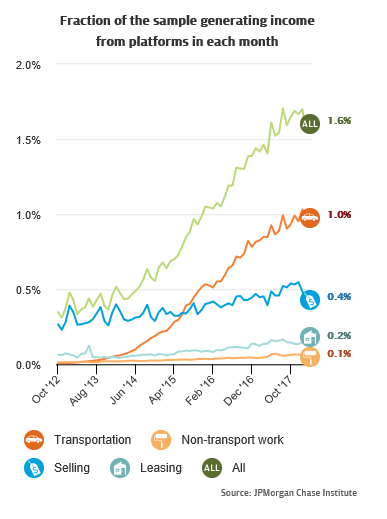
We expect the sharing and gig economies in New Zealand to follow a similar pattern.
The JP Morgan Chase & Co Institute study also shows that the sharing and gig economies are not replacing traditional work for most people but are being used to supplement their earnings from it. This also seems consistent with the New Zealand experience, as the self-employment rate here has been declining moderately since 2000.[56]
We do not have many statistics in New Zealand for the sharing and gig economies. For accommodation, Airbnb is the main provider in New Zealand. Airbnb guests spent $781.4 million in 2017, representing 2.8% of all tourism expenditure in New Zealand.[57]
For transport platforms, Uber is the main provider in New Zealand. Uber has not publicly released its revenue for New Zealand, but it notes that New Zealand riders travelled a combined 83,158,994 kilometres using the Uber app in 2018 – the equivalent of travelling to the moon and back 108 times.[58] Uber’s global revenue for 2018 (including from Uber Eats, its food delivery business) was $11.4 billion (up 43% from 2017) on gross driver bookings of $50 billion (up 43%). Uber is still loss making, with $1.8 billion of adjusted losses (down 15%).[59]
Trademe is the main platform New Zealanders use to buy and sell goods to each other. For its financial year ended June 2018, Trademe’s annual revenue was $250.4 million (up 6.6% from 2017) with net operating profits of $96.6 million (up 3.9%).[60]
There are some concerns with the sharing economy however. It can undermine traditional business sectors, such as the taxi and hotel industries. Workers in the gig economy also lack employment protections (as they are classified as independent contractors) and may earn uncertain and/or low income.
Online advertising
Online advertising is the other important component of the digital economy for tax purposes.
According to the OECD, time on the Internet has overtaken time spent on traditional media channels in many countries. This is largely driven by growth in the use of mobile devices, with mobile searches outstripping desktop searches in the last few years. Traditional avenues for reaching consumers (especially younger consumers) are becoming less relevant and are being replaced by online channels. Recent growth in advertising revenue has been largely driven by double digit growth in online advertising, and for the first time in 2017, global expenditure on online advertising outstripped television advertising expenditure. To give an idea of the importance of advertising to some of the biggest tech companies, advertising is Google’s primary revenue source, accounting for US$79 billion in 2016.[61] Kiwis are now spending around half of their media consumption time online.[62]
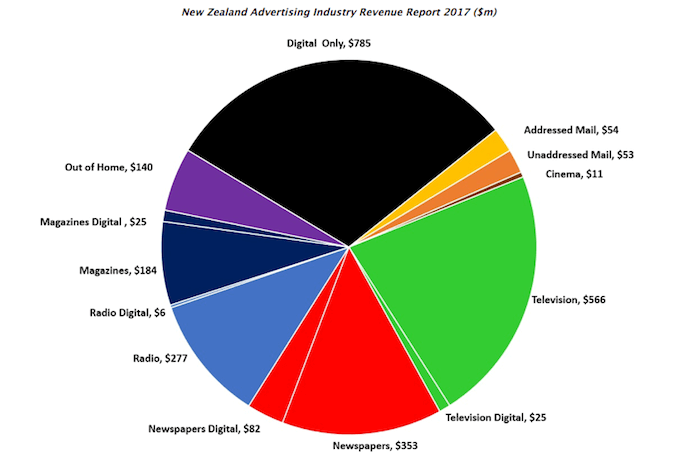
For New Zealand, the total online advertising market for 2017 was $923 million, which was 36% of New Zealand’s total advertising market ($2.561 billion) and an increase of 9.7% over the previous year.[63]
Figure 4 shows the composition of the New Zealand advertising market in 2017.[64]
Figure 4
Search accounted for 62% of total online advertising in the third quarter of 2018[65] and the total online advertising revenue for the quarter was $266 million ($1.064 billion on an annualised basis). It is not clear exactly what proportion of online advertising is supplied by non-residents, however it is likely to be between 60–75%.
[41] See the report Digital New Zealanders: The Pulse of our Nation, Digital inclusion research group, 2017.
[42] See MBIE’s report Information and Communications Technology, 2017
[43] See the European Commission’s Impact Assessment on a DST – SWD(2018) 81 final, page 10, https://ec.europa.eu/taxation_customs/sites/taxation/files/fair_taxation_digital_economy_ia_21032018.pdf
[44] Australian Productivity Commission and New Zealand Productivity Commission, Growing the digital economy in Australia and New Zealand. Maximising opportunities for SMEs, 2019.
[45] https://wearesocial.com/blog/2018/01/global-digital-report-2018
[46] Diaz Andrade, A., M.R., Karimikia, H. & Techatassanasoontorn, A., World Internet Project: The Internet in New Zealand 2017. New Zealand Work Research Institute, Auckland, 2018.
[47] World Internet Project New Zealand.
[48] Hootsuite, we are social, 2018, https://www.slideshare.net/wearesocial/digital-in-2018-in-oceania-part-2-east
[49] Ministry of Business, Innovation and Employment, Information and Communications Technology, 2017.
[50] https://www.statista.com/study/44442/statista-report-b2b-e-commerce/
[51] https://www.shopify.com/enterprise/global-ecommerce-statistics
[52] These figures are taken from an unpublished MBIE report in August 2017. The MBIE figures are based on information published by the BNZ (https://www.bnz.co.nz/business-banking/support/commentary/online-retail-sales-index) and Nielsen (http://www.nielsen.com/nz/en/insights/news/2016/new-zealanders-open-their-laptop-lids-instead-of-their-wallets.html).
[53] https://www.focus-economics.com/country-indicator/new-zealand/retail-sales
[54] https://www.statista.com/statistics/830986/value-of-the-global-sharing-economy/
[55] Farrell, Diana, Fiona Greig, and Amar Hamoudi, The Online Platform Economy in 2018: Drivers, Workers, Sellers and Lessors, JPMorgan Chase Institute, 2018, https://www.jpmorganchase.com/corporate/institute/report-ope-2018.htm
[56] https://ecoprofile.infometrics.co.nz/auckland/Employment/SelfEmployment
[57] Deloitte, Economic effects of Airbnb in New Zealand, 2018.
[58] https://www.uber.com/en-NZ/newsroom/nz2018review/
[59] https://www.cnbc.com/2019/02/15/uber-2018-financial-results.html
[60] Although Trade Me would not be caught by a DST if it had a €750 million global turnover de minimis threshold.
[61] OECD, Online Advertising: Trends Benefits and Risks for Consumers, January 2019.
[62] Mosh Social Media, The New Zealand Facebook Report 2017, 2017.
[63] New Zealand Advertising Industry Revenue Report 2017, http://www.asa.co.nz/wp-content/uploads/2018/04/ASA-2017-Media-Turnover.pdf
[64] http://www.asa.co.nz/wp-content/uploads/2018/04/ASA-2017-Media-Turnover.pdf
[65] IABNZ Ad-Spend Report Q3 2018, https://www.iab.org.nz/news/q3-2018-interactive-revenue-grows-13-yoy/