Appendix 1 - Statistics
Profile of QCs, LAQCs and LTCs
Table 8 shows that there were a large number of LAQCs and QCs before the 2010 Budget. The vast majority (95 percent) were LAQCs, suggesting that access to losses at the personal level was a major attraction in the formation of QCs. Most LAQCs with activity (about 80 percent) attributed losses.
However, around 20 percent of LAQCs were tax-paying. These could have been companies in cyclical industries, or they could have represented companies that had start-up losses after they were established, but had now matured and become profitable; or profitable firms that might eventually have losses to attribute.
Since the 2010 reforms, the composition has changed significantly. Companies that were LAQCs have become either QCs or LTCs. However, Table 9 indicates that there are fewer entities overall in these categories, suggesting that some have chosen to wind up or carry out business under another form.
Many of these new LTCs are involved in real property. This tallies with earlier data on the distribution of QC/LAQC losses by industry, as shown in Table 10.
| Tax year | |||
| 2011 | 2012 | 2013 | |
| LAQCs | 133,617 | 1,310 | 0 |
| QCs | 6,282 | 80,346 | 68,844 |
| LTCs | 0 | 43,826 | 46,182 |
Before Budget 2010, half the companies passing through losses were in the property industry. But loss pass-throughs were widely distributed across the other industries. For most industries, around half the firms were passing through losses.
Distributions of LTC and QC income and losses
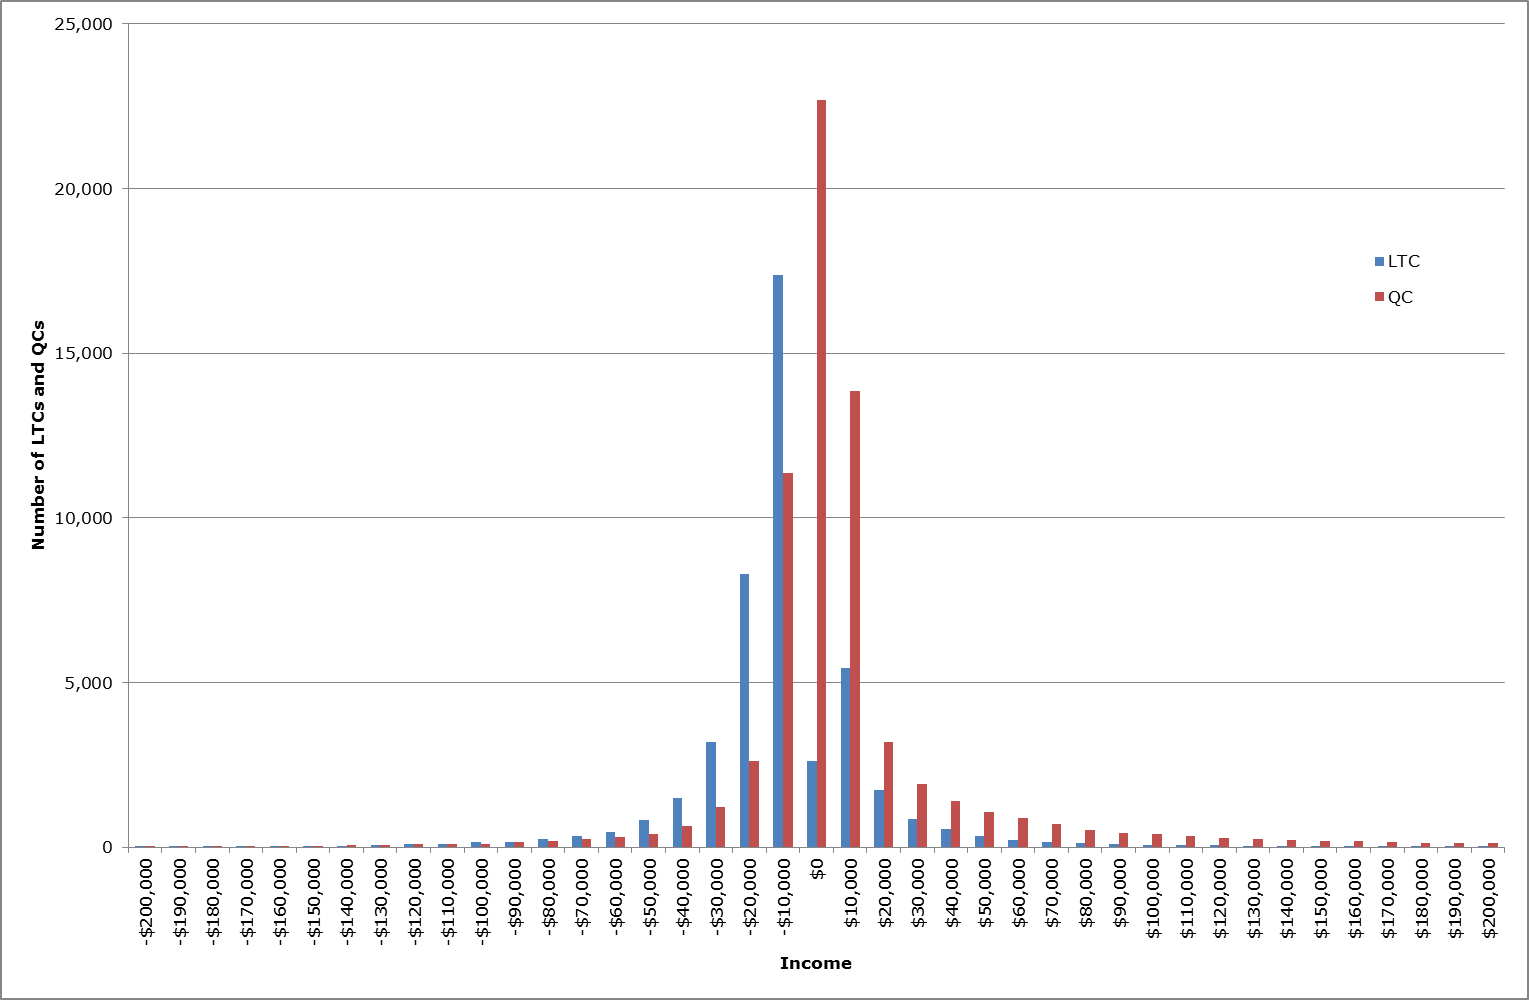
Charts 2 and 3 show the distribution of reported income and losses for LTCs and QCs in 2013. 80 percent of LTCs fell into the loss/income range -$30,000 to +$10,000 while 80 percent of QCs fell within the -$20,000 to +$20,000 range. Given that LTCs allow loss flow-through, it is not surprising that a higher proportion of LTCs were reporting losses, although the difference is not great.
Chart 2: Distribution of combined LTC and QC income – 2013 tax year
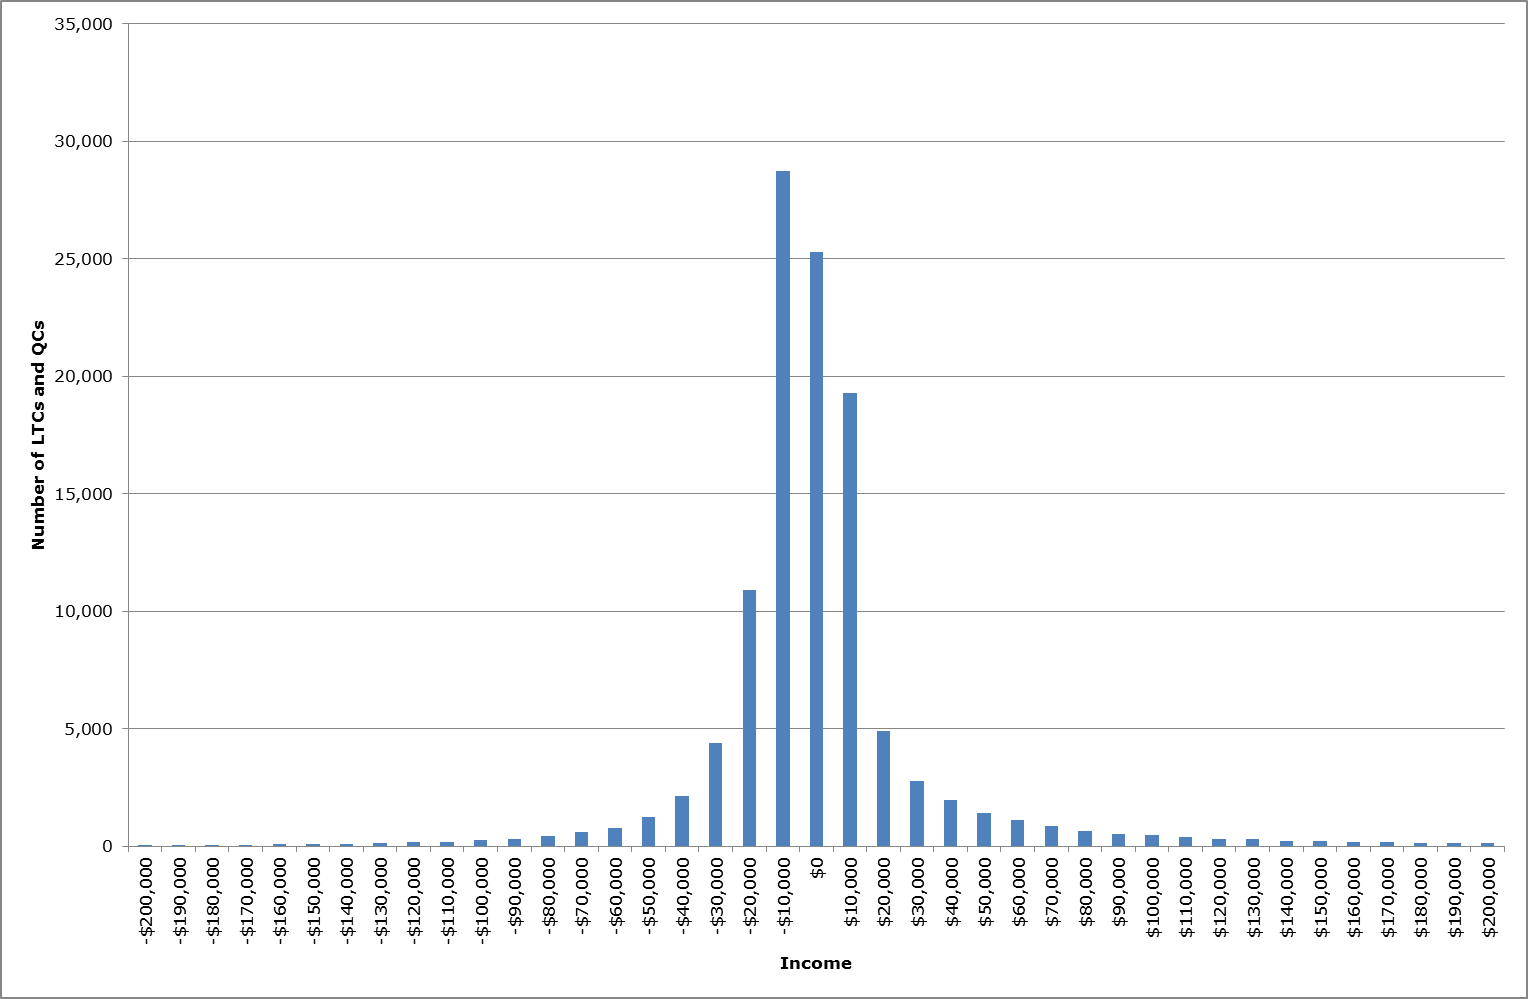
Chart 3: Distribution of LTC and QC income – 2013 tax year
Deduction limitation rule
In terms of non-allowable deductions, the number of LTCs reporting non-allowable deductions carried forward as at the end of the 2013 tax year was 446 (around one percent of total LTCs). The number of look-through owners affected was 695. The average value of non-allowable deductions carried forward per owner was $16,547.
Overseas income
*almost a complete year
Distribution of LTC owners
| Number of owners | Number of LTCs |
|---|---|
| 1 | 14,002 |
| 2 | 28,556 |
| 3 | 2,149 |
| 4 | 992 |
| 5 | 197 |
| 6 | 89 |
| 7 | 20 |
| 8 | 13 |
| 9 | 5 |
| 10 | 1 |
| 11 | 1 |