2. The New Zealand tax system and how it compares internationally
This chapter examines New Zealand’s tax system and benchmarks it against the tax systems of other countries. In particular, it comments on some of the likely economic efficiency and distributional effects of New Zealand’s tax settings.
The main objective of taxation is to raise revenue to fund the Government’s expenditure. This should be done in a way that is considered to be fair. Tax is, however, costly to impose. There are direct costs associated with administration and compliance, but also costs associated with distortions in people’s behaviour.
Almost all taxes distort behaviour. For example, the imposition of a personal income tax may result in a person working less than they would have in the absence of the tax. Alternatively, a person may choose to pursue less education because of the tax as they will not benefit as much from the higher salary that more education would bring. These distortions often affect economic growth and productivity. That said, a tax can still distort behaviour even though it does not affect economic growth or productivity. For example, in a small open economy like New Zealand, taxes on saving might, at least in theory, have little effect on GDP or growth while still being quite distorting. The same could potentially be true of a stamp duty on housing or high taxes on certain goods but not others. Distortions arise because of the way a tax induces people to do things that they would not desire in the absence of the tax.
To minimise these distortions, New Zealand has adopted a tax paradigm generally characterised as “broad-based, low-rate” (BBLR). The fundamental idea is to have a broadly defined tax base, which allows tax rates to be lower, thereby reducing the costs associated with taxation. Low personal tax rates, for example, minimise the disincentive to work created by an income tax. Further, having low rates and a broad base reduces biases between different forms of saving.
Key observations
Our overall impression is that the New Zealand tax system generally performs well. It is not in need of major overhaul. It raises revenue to finance Government spending in ways that are relatively fair and efficient.
New Zealand gains the bulk of its revenue from three main taxes: company income, personal income and GST. It has removed very inefficient taxes on transactions and turnover that many other countries have.
Tax as a proportion of GDP is slightly below OECD averages and has declined markedly over the last few years. An important choice for the Government is whether it wishes tax revenues to increase, decrease or remain reasonably steady over time. New Zealand has, like other countries, faced a cyclical decline in tax revenue as a result of the global financial crisis but there were also important policy steps which reduced tax revenue between 2004–¬05 and 2009–10. New Zealand’s fiscal position and ageing population are likely to create fiscal constraints which limit the scope for tax cuts without offsetting tax increases in the short- to medium-term. This and the fact that tax changes must be seen to be fair mean that tax changes are unlikely to be a “silver bullet” for driving economic growth. It is likely that cuts in distorting taxes will need to be balanced by increases in other distorting taxes unless substantial cuts in Government spending are possible.
The most recent available data suggests that by OECD standards New Zealand obtains a relatively large share of its tax revenue by way of taxes on income and profits (including company and personal income taxes). These are among the taxes that the OECD has identified as being worst for growth. But New Zealand does not have certain other taxes which the OECD includes in the “worst for growth” territory and does not look particularly out of line when these other taxes are included.
New Zealand’s three main tax bases (personal tax, company tax and GST) all have broad bases, allowing substantial amounts of tax to be collected at modest tax rates. These settings are designed to reduce the costs of taxation. For the personal income tax and GST, New Zealand has low rates but high revenues compared with other OECD countries. Our company tax rate remains higher than the OECD average despite the recent reduction to 28%. There are pros and cons in reducing the company tax rate further. While revenue from company tax is also relatively high compared with other OECD countries, it has reduced markedly in recent years. We need to monitor whether this is simply a cyclical downturn or evidence of a structural fall in company tax revenues.
New Zealand performs well in terms of tax administration, and compliance costs are likely to be broadly average or slightly below other OECD countries.
When considering progressivity and redistribution it makes little sense to look at New Zealand’s tax system in isolation. A substantial amount of redistribution in New Zealand takes place through transfer payments and, in particular, Working for Families. For the most recent year data are available, tax progressivity for a single individual without children seems broadly consistent with OECD averages. But there are big differences in average tax rates for households with and without children. A single income earner household with two children pays a very much lower average tax rate than a single income earner household with no children. The difference between these households is bigger in New Zealand than for any other OECD country. This reflects the fact that much redistribution in New Zealand is targeted at households with children. This is arguably a relatively targeted and hence cost-effective way of redistributing income.
While New Zealand generally has low personal rates of tax, individuals can face considerably higher effective marginal tax rates (EMTRs) as a result of abating social assistance (especially through Working for Families). High EMTRs will distort decisions, reducing incentives to work and upskill, and limiting the scope for people to change their circumstances. However, relatively low numbers of individuals are subject to very high EMTRs which means that these high EMTRs may be less distorting than is sometimes thought. There are difficult tradeoffs in making changes in this area. Reducing EMTRs will either mean reducing assistance to needy families, or increasing costs.
New Zealand and the rest of the world
New Zealand’s BBLR approach is reflected in the graphs below. Despite modest tax rates, New Zealand collects reasonably large amounts of revenue from its major tax bases. Our GST base, in particular, is very broad. (See figure 1)
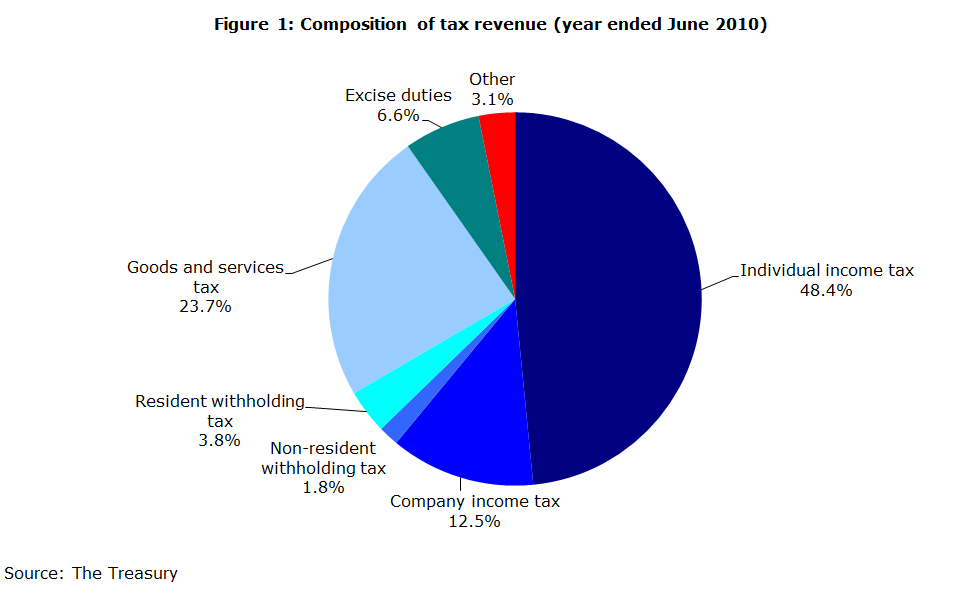
Including resident and non-resident withholding taxes, we obtain about 90 percent of our tax revenue from personal and corporate income (or other similar taxes) and GST. In particular, we have largely removed taxes on transactions or turnover that international reviews such as the Henry Review in Australia and the Mirrlees Review in the United Kingdom have identified as being particularly inefficient.
Tax as a percentage of GDP
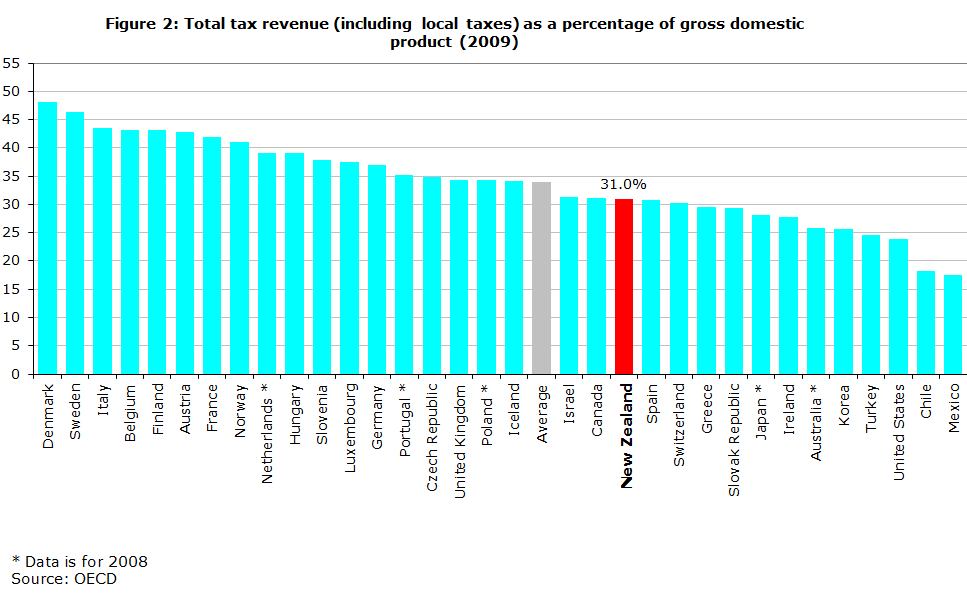
For the 2009–10 year, New Zealand’s tax revenue amounted to 31 percent of GDP. (See figure 2) This placed New Zealand slightly below the OECD average.[1]
One obvious change relative to figures reported in our previous BIM (2008) is that New Zealand’s tax revenue as a percentage of GDP has fallen significantly in recent years from 35.1 to 31.0 percent of GDP since 2007.[2] This is considerably larger than the fall experienced by OECD nations on average; the OECD-average fell 1.5 percentage points from 35.4 percent to 33.9 percent.
Some of the decline will be attributable to the global financial crisis. But there have also been significant tax reforms enacted since 2008 that will also be reflected in this reduced tax to GDP ratio. We estimate that about 2.5 percentage points of this decline is attributable to policy changes with the remainder attributable to the global financial crisis.
There have also been significant increases in transfers through changes in Working for Families and the introduction of KiwiSaver. The combined effect of the transfer and tax policy changes is shown in figure 3.
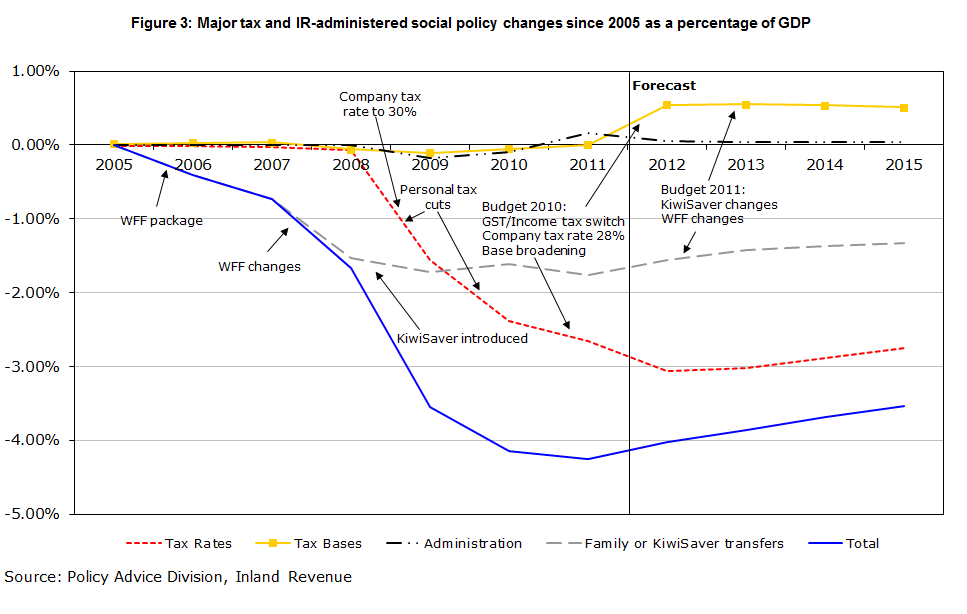
Overall, estimated net revenue (taxes less Inland Revenue-administered social policy) is approximately 4 percent of GDP lower than it would have been had 2005 policy settings continued unchanged.
To a large extent, the personal tax changes between 2004–05 and 2009–10 were financed by returning “fiscal drag”. Over the later 1990s and early 2000s average tax rates increased. When inflation and real wages increased, tax brackets were not adjusted to keep average tax rates unchanged. This is commonly referred to as fiscal drag. After the October 2008 cut in the bottom marginal tax rate and the increase in personal tax thresholds and further April 2009 cuts, average tax rates for PAYE earners were returned to their levels 10 years previously. The October 2010 tax cuts further lowered average tax rates but were, of course, offset by an increase in the rate of GST. (See figure 4)
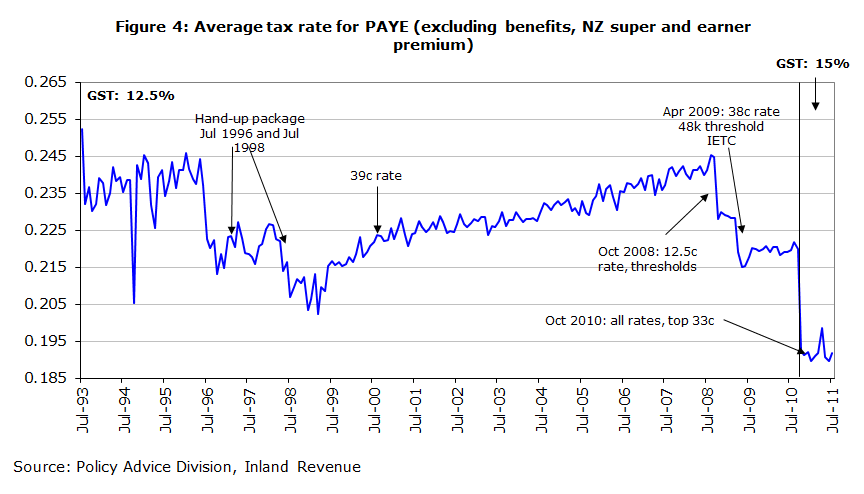
An important question for the Government is whether it wishes to return fiscal drag by adjusting the personal tax scale as future inflation and real wage growth pushes people on to higher average tax rates.
When looking ahead, we are obviously in a tight fiscal position. The Government now faces a significant deficit and an ageing population which between 2009 and 2050 is expected to increase the cost of New Zealand Superannuation by approximately 3 percent of GDP. This will constrain choices for the near future – without a significant cut in public services, any tax cuts are likely to have to be funded from tax increases elsewhere. A substantial cut in the company tax rate, for example, would need to be funded through higher personal tax rates or GST, or possibly some new tax base. Base broadening may also provide additional funding, but New Zealand’s tax bases are already very broad.
Tax mix
Compared with other OECD countries, New Zealand collects a relatively high proportion of its taxes from income and profits. (See figure 5)[3] This is largely because – unlike other OECD countries –¬ New Zealand has no social security tax or payroll taxes. The OECD considers that taxes on corporate and personal income along with social security taxes and payroll taxes are those which are most harmful to growth. Often the economic incidence of social security taxes will fall on employees and may have similar effects to an income tax in distorting labour supply decisions.[4] Since social security taxes, unlike an income tax, do not tax savings and investment income they will not, however, distort savings or investment decisions.[5]
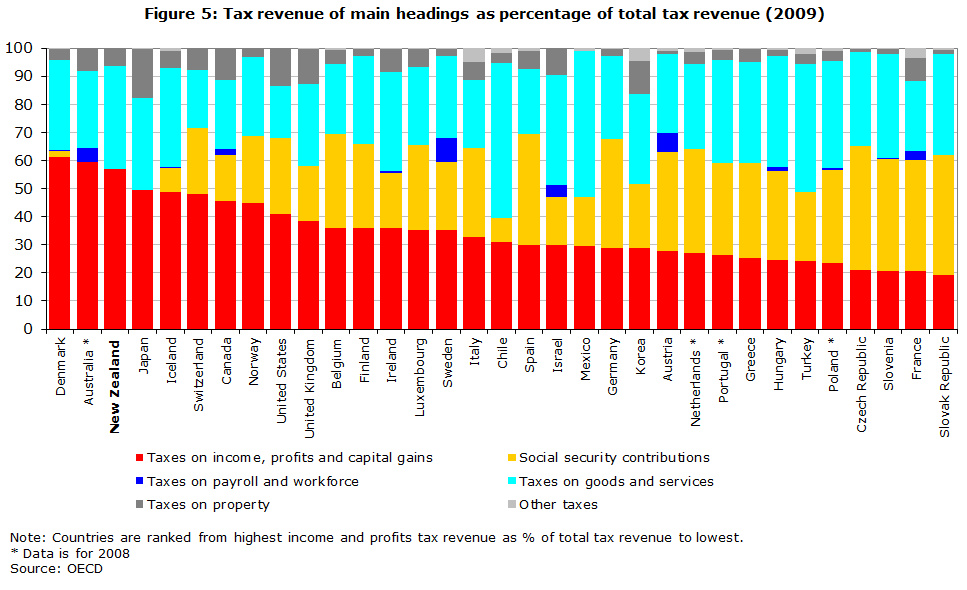
New Zealand has the third highest proportion of tax on income, profits and capital gains within the OECD (behind Denmark and Australia), but it is broadly in line with other countries once social security contributions and payroll taxes are taken into account.
GST, company tax and income tax collections
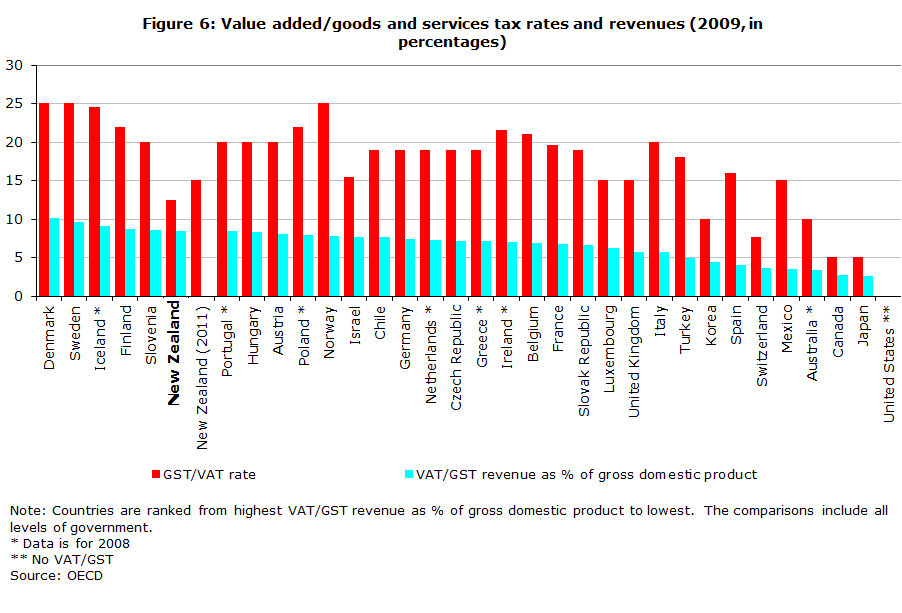
Compared with most OECD countries, New Zealand has relatively broad bases for GST, company income and personal income. These taxes collect substantial revenue as a percent of GDP despite relatively modest rates. A country that has a broadly defined tax base will collect more in tax as a fraction of GDP compared with a country with the same tax rate but a narrower base, all else being equal. This indicates that New Zealand has been relatively successful in implementing the BBLR taxation paradigm.
As shown in figure 6, in 2009 New Zealand’s GST collections amounted to 8.5 percent of GDP – the sixth highest in the OECD.[6] New Zealand’s GST rate at the time was 12.5% – the sixth lowest in the OECD (excluding the United States, which has no GST). This shows that New Zealand’s GST base is comparatively very broad. The recent rise in the rate of GST will, of course, increase GST collections as a percent of GDP.
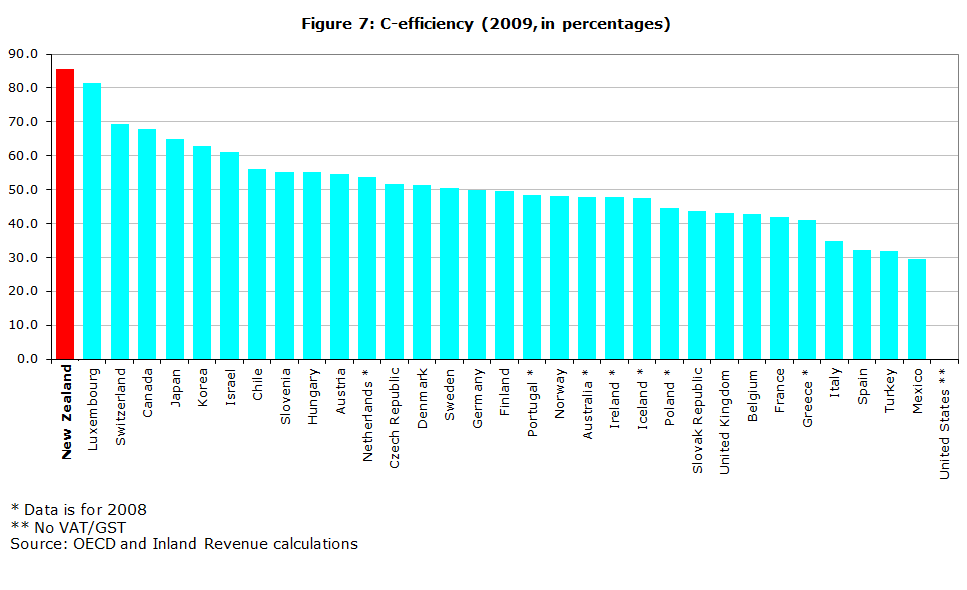
Another measure of how broadly defined a country’s GST base is the “c-efficiency” ratio. This compares the revenue actually collected from a country’s GST to that which would have been raised if the “standard rate” of tax were applied to all consumption. Internationally New Zealand has the broadest GST base in the OECD. (See figure 7)
In 2009 (for New Zealand 2009–10) the top personal tax rate was 38%, the sixth lowest in the OECD.[7] Despite this low rate, New Zealand ranked sixth in the OECD in terms of personal tax collected as a percent of GDP – due in part to its wide base. For example, New Zealand does not allow interest deductions for a person’s own house and does not provide very large tax incentives for retirement savings. Again, this reflects New Zealand’s BBLR paradigm.
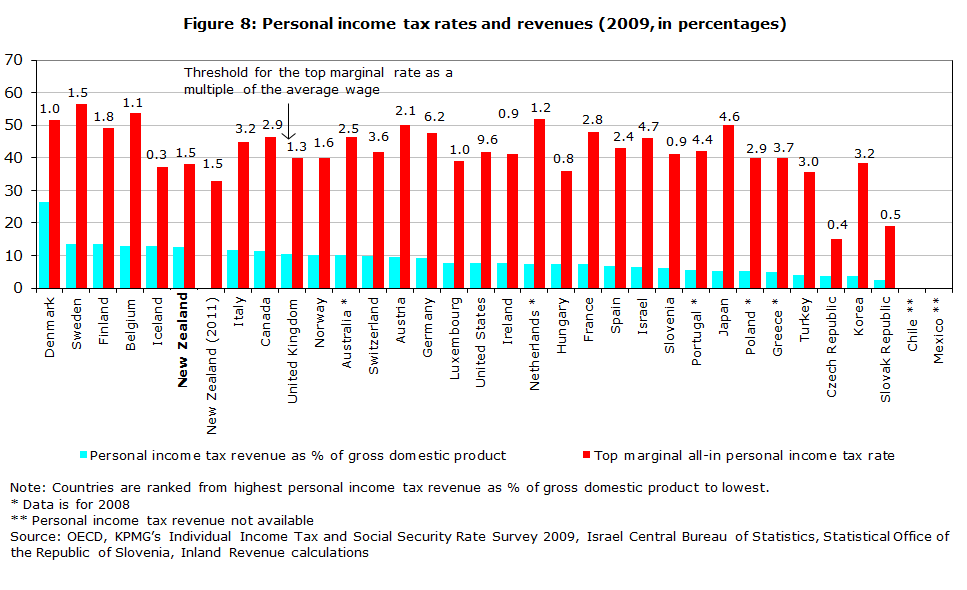
Personal tax was 12.7 percent of GDP, down from 14.9 percent of GDP reported for 2006–¬07 in our last BIM. This reduction in personal tax collections is likely to be largely the result of personal tax cuts. (See figure 8)
Another reason for the high tax take from personal income tax despite the modest top tax rate is that the tax scale is relatively flat. The top tax rate begins applying at a low level of income (1.5 times the average wage) and the difference between the top and bottom tax rates is relatively small (25.5 percentage points in 2009 and 22.5 percentage points due to the Budget 2010 tax cuts).
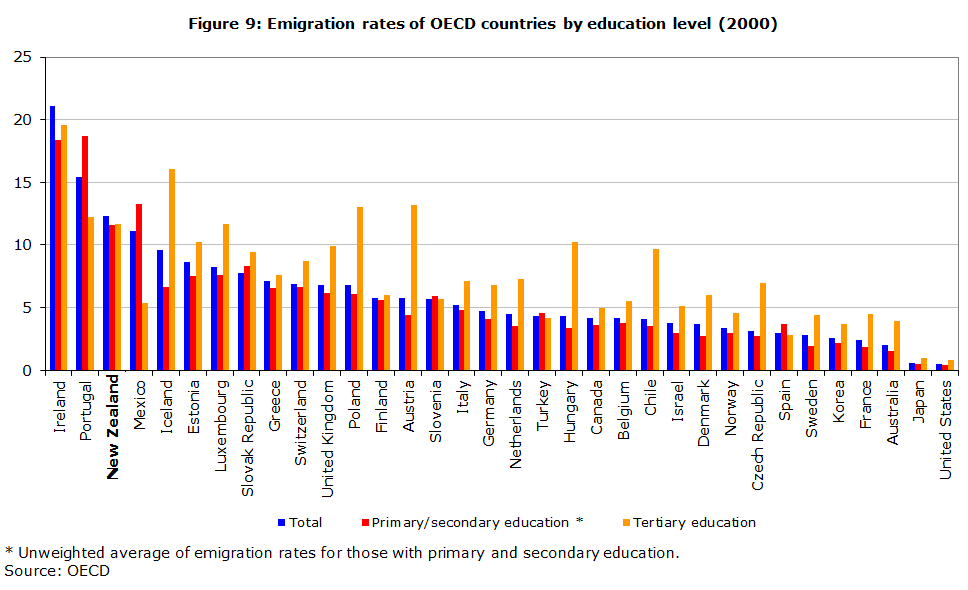
One concern about a high top personal marginal rate is that it results in higher average tax rates on able individuals which may encourage talented New Zealanders to leave or discourage talented non-residents from coming to New Zealand. The most recent OECD data suggests that New Zealand has a very mobile labour force and has the third highest level of domestically-born individuals living abroad. (See figure 9)
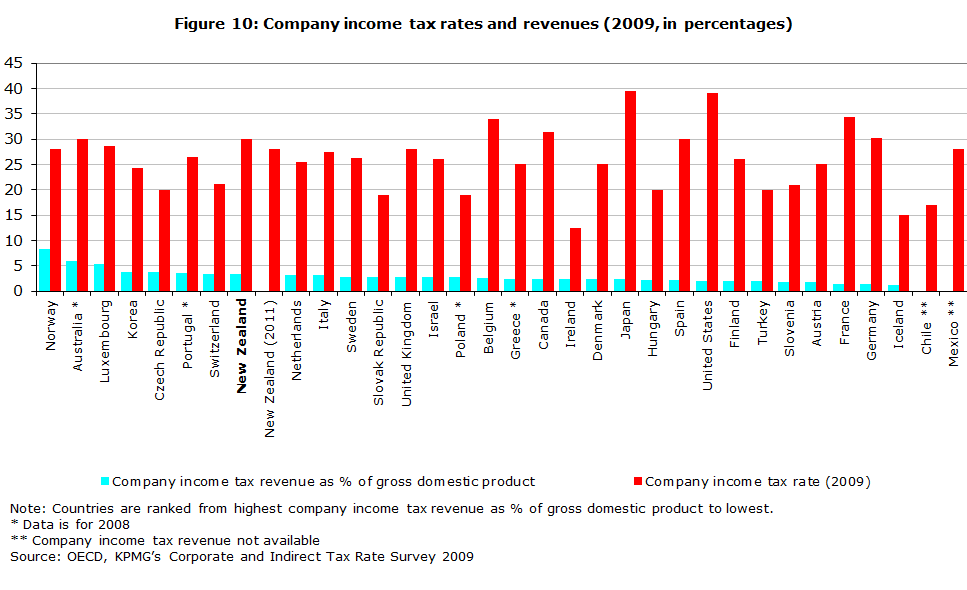
Company tax is also an important part of New Zealand’s tax base. In 2009, New Zealand collected 3.3 percent of GDP in company tax, the sixth highest in the OECD. At that time, New Zealand’s company tax rate was the seventh equal highest in the OECD, although it has since dropped to 28%. There has been a reasonably large decline in company tax as a percentage of GDP from the previous BIM, when company tax was 5.8 percent of GDP. A small part of this decline will be explained by the decrease in tax rate from 33% to 30% at the start of the 2008¬–09 income year. For the remainder, we need to monitor whether this is simply a cyclical downturn or evidence of a structural fall in company tax revenues. (See figure 10)
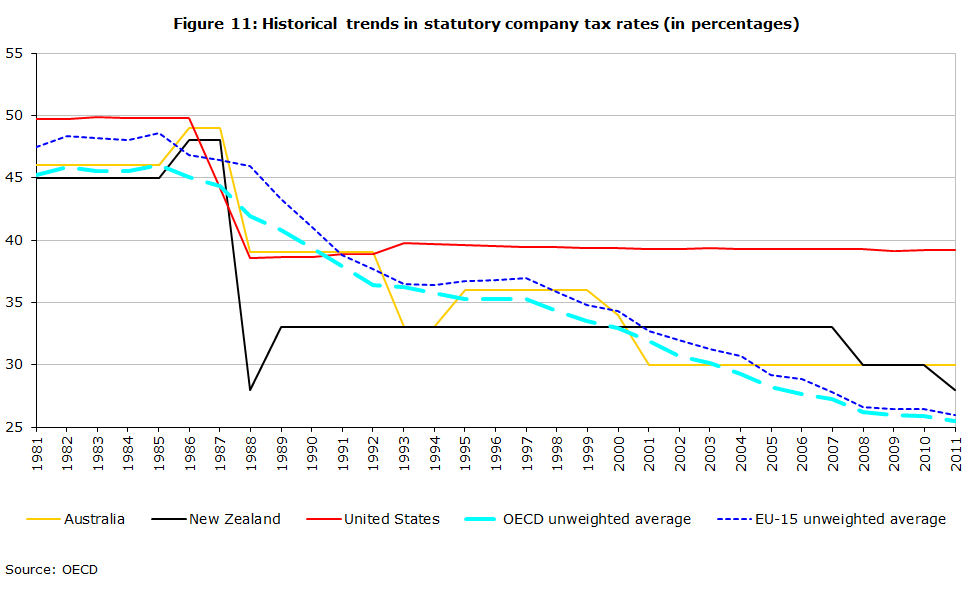
Even given its recent reduction, New Zealand’s company tax rate remains higher than average for the OECD. At the beginning of the 2011–12 year, the average company tax rate among the OECD was 25.5%. (See figure 11)
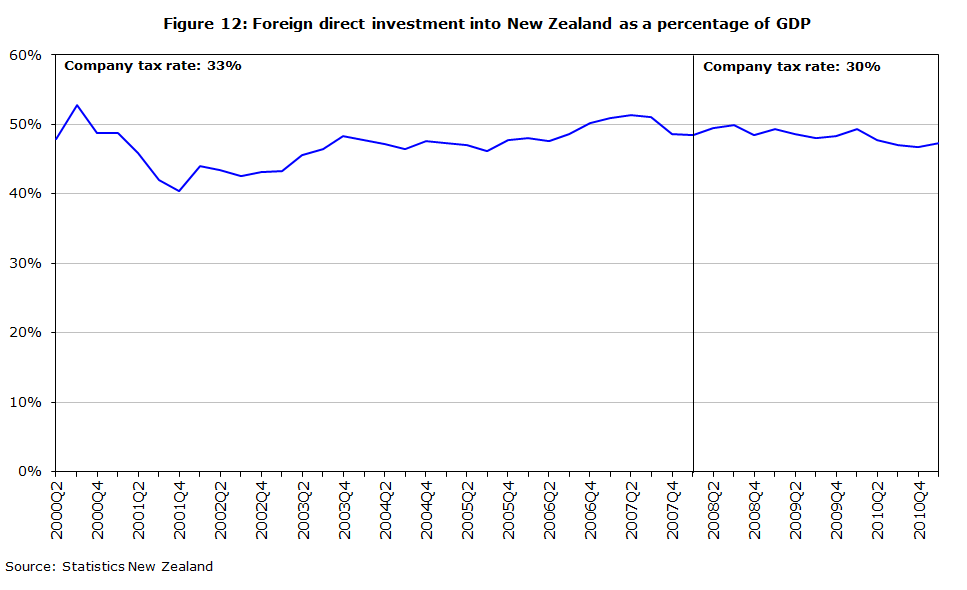
One reason for potential concern about New Zealand’s relatively high company tax rate is that this may make it less attractive for foreigners to invest into New Zealand. This has been cited as a potential concern by recent tax reviews. A recent survey found that, on average across different studies, a 1 percentage point cut in the company tax rate leads to a 3.72 percent increase in foreign direct investment (FDI).[8] However, there are many significant non-tax factors which affect FDI and these differ between countries. It might be expected that investment into many other countries may be much more sensitive to tax than investment into New Zealand, because of New Zealand’s small size and geographic isolation.
Taken at face value, the studies would suggest that cutting New Zealand’s company rate from 33% to 30% in 2008 would have boosted FDI by about 11 percent (a difference of about 5.5 percent of GDP from about 50 percent to roughly 55.5 percent of GDP). In fact, since 2008 there has been a small decline in FDI, although it is difficult to know what would have happened in the absence of the tax change and international turmoil in recent years with the global financial crisis. Other things considered, one would have predicted the company rate cut would have had some effect in boosting FDI but the data provide no evidence of an upswing. (See figure 12)
It is too early to see the effects of the more recent cut in the company rate from 30% to 28%. The effects of this on boosting FDI will be more difficult to disentangle because of changes to the depreciation rules and to the thin capitalisation rules. These policy changes will have tended to have an offsetting effect on FDI.
This underlies an important point. Tax is not a “silver bullet”. There are many factors besides tax that determine people’s behaviour. While taxes do distort behaviour in significant ways and should be levied in the fairest and least distorting way possible, tax can be a blunt instrument for attaining wider economic goals. This is likely to be especially true in a constrained fiscal environment if cutting one tax means increasing others and if fairness concerns prevent the Government from making the tax system more efficient but less progressive.
Administration and compliance costs
In terms of ease of paying tax, according to a World Bank/PricewaterhouseCoopers’ study, New Zealand ranks 10th in the OECD and 36th overall as shown in table 1.
| Survey rank | Rank amongst OECD | Survey rank | Rank amongst OECD | ||
|---|---|---|---|---|---|
| Ireland | 5 | 1 | Israel | 59 | 18 |
| Canada | 8 | 2 | United States | 72 | 19 |
| Switzerland | 12 | 3 | Belgium | 77 | 20 |
| Denmark | 14 | 4 | Portugal | 78 | 21 |
| Luxembourg | 17 | 5 | Turkey | 79 | 22 |
| United Kingdom | 24 | 6 | Austria | 82 | 23 |
| Norway | 27 | 7 | Greece | 83 | 24 |
| Finland | 28 | 8 | Slovenia | 87 | 25 |
| Iceland | 35 | 9 | Germany | 89 | 26 |
| New Zealand | 36 | 10 | Mexico | 109 | 27 |
| Korea, Rep. | 38 | 11 | Hungary | 117 | 28 |
| Netherlands | 43 | 12 | Czech Republic | 119 | 29 |
| Chile | 45 | 13 | Japan | 120 | 30 |
| Spain | 48 | 14 | Poland | 128 | 31 |
| Sweden | 50 | 15 | Slovak Republic | 130 | 32 |
| Australia | 53 | 16 | Italy | 134 | 33 |
| France | 58 | 17 |
Source: World bank / PricewaterhouseCoopers
While New Zealand’s ranking is above average for OECD countries, it is clearly not as good as the 2nd place reported in our previous BIM. We understand that the apparent decline in New Zealand’s position is because of a change in the survey method rather than evidence of increasing costs of doing business. Our own research on small-to-medium enterprises suggests that compliance costs for these firms fell by 1.3 percent over the period from 2004 to 2009.
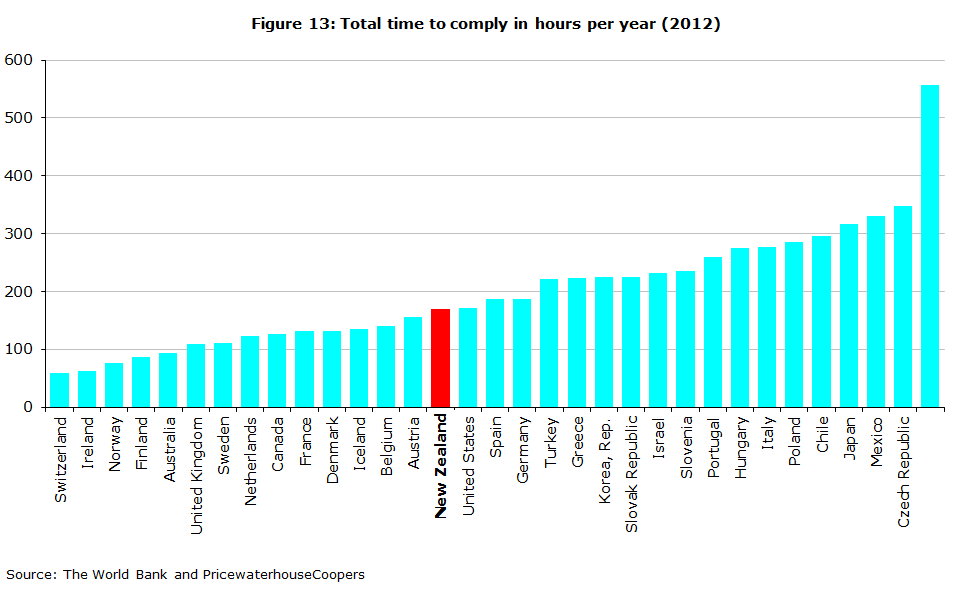
A significant component of “ease of paying taxes” is the total time a particular type of firm is expected to take in complying with its tax obligations. In the 2012 survey, New Zealand ranks in the middle of the OECD with 172 hours. (See figure 13) This includes 24 hours to allow for the recent increase in the GST rate. Excluding this one-off adjustment New Zealand would rank 14th with 148 hours; below average, but only just. The time for taxpayers to comply is clearly something that needs to be monitored and keeping compliance costs low is an important focus for future tax reform.
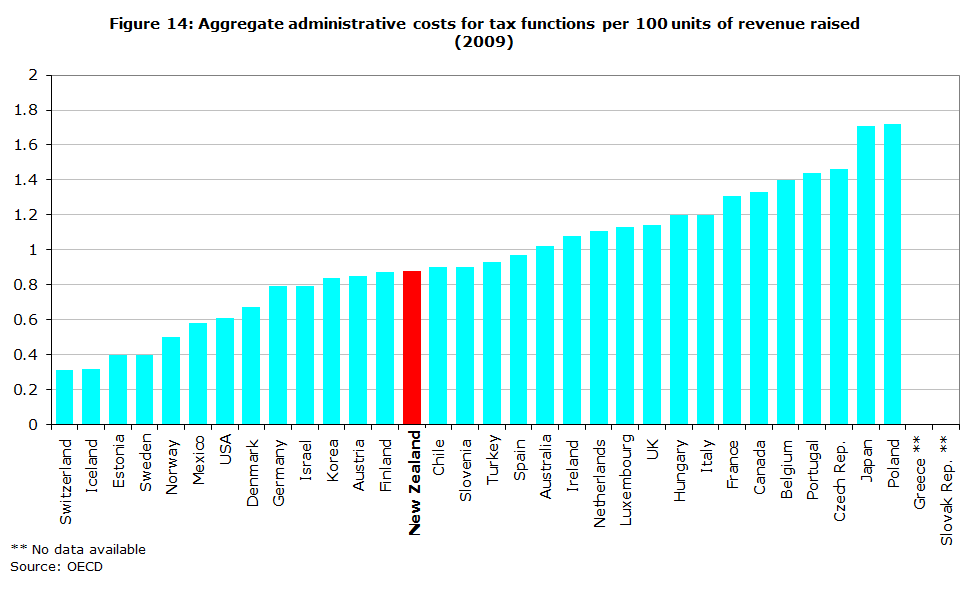
Figure 14 shows the cost of raising 100 units of revenue across the OECD. New Zealand is somewhat below the average, with an administrative cost of $0.88 to raise $100 of revenue for the 2009–¬10 year. However, these costs have been increasing over time – in 2007 the cost was $0.75 per $100 of revenue. To a large extent, the higher costs of collection are likely to reflect the combined effects of policy changes and the cyclical downturn, which have reduced tax collections recently, rather than increasing administration costs.
Inland Revenue’s administration compares favourably on other measures of administration costs. In a 2011 international benchmarking study of revenue departments in 10 countries including New Zealand, Australia and the United Kingdom, New Zealand ranked in the top three for 26 out of the 42 indicators used. As discussed further in chapter 4, the department has made significant cost savings recently which will reduce the costs of raising revenue.[9]
Progressivity
New Zealand has a fairly flat income tax scale. The top tax rate applies at 1.5 times the average wage. Many other countries have top personal tax rates that are both higher and apply at a higher level of relative income.
At first impression, it might appear that New Zealand operates a relatively unprogressive tax system, but this story is incomplete. There are many ways to redistribute income; using the income tax system is just one of them. New Zealand delivers a large amount of redistribution through the Working for Families programme of tax credits. It is really the progressivity of the income tax system and transfer systems together that is relevant.
Moreover, other taxes including payroll taxes and social security taxes can affect progressivity. For individuals without children, New Zealand does not appear out of line with the OECD in terms of progressivity.
Direct comparisons of progressivity are difficult, but a common method for comparing progressivity among nations is to compare “average tax wedges” at different income levels. A person’s average tax wedge is the sum of taxes likely to be borne by employees less cash transfers (such as Working for Families) as a fraction of total labour cost. Table 2 compares the tax wedge for a single earner with no children earning 67, 100 and 167 percent of average weekly earnings (AWE).
| 2000 | 2010 | |||||
|---|---|---|---|---|---|---|
| % of AWE | NZ | Aust | OECD | NZ | Aust | OECD |
| 67% | 18.6 | 25.3 | 33.5 | 14.2 | 19.7 | 31.3 |
| 100% | 19.4 | 30.4 | 36.7 | 16.9 | 26.2 | 34.9 |
| 167% | 24.2 | 38.3 | 41.1 | 23.2 | 31.7 | 39.4 |
| Diff. 167%–67% | 5.6 | 13.0 | 7.6 | 9.0 | 12.0 | 8.2 |
Source: OECD
For 2010 (the 2010–11 year in New Zealand), the difference between tax wedges for someone on 67 and 167 percent of AWE is similar to the average for the OECD (see the bottom line of table 2).
The progressivity of the system in New Zealand is markedly affected by family status. New Zealand provides significant transfers to lower-income families with children through the Working for Families programme of tax credits. Figure 15 shows that the bottom 50 percent of households, on average, do not pay any “net tax” (excluding GST). Ideally, GST and other taxes would be included in the data but this information is not available. Net tax is defined as income tax paid less cash transfers received. For example, if a household pays $10,000 in tax but receives $15,000 in Working for Families tax credits, the household’s net tax will be -$5,000.
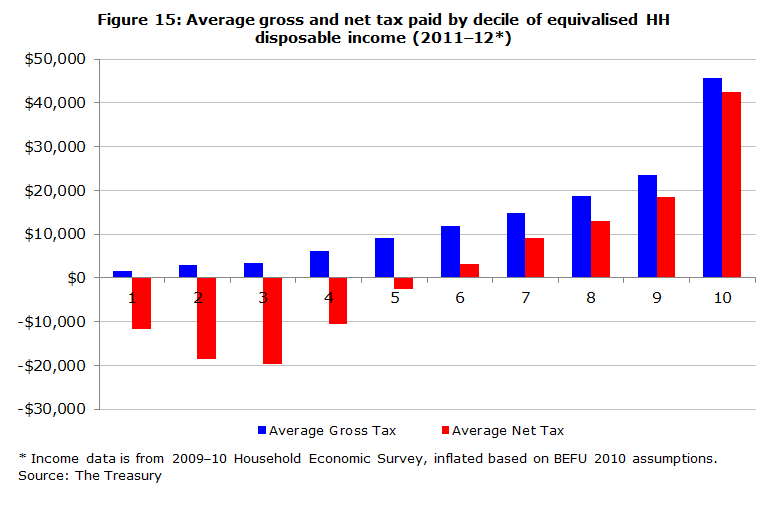
Tax payments made by those on higher incomes have an important role in funding Government spending.
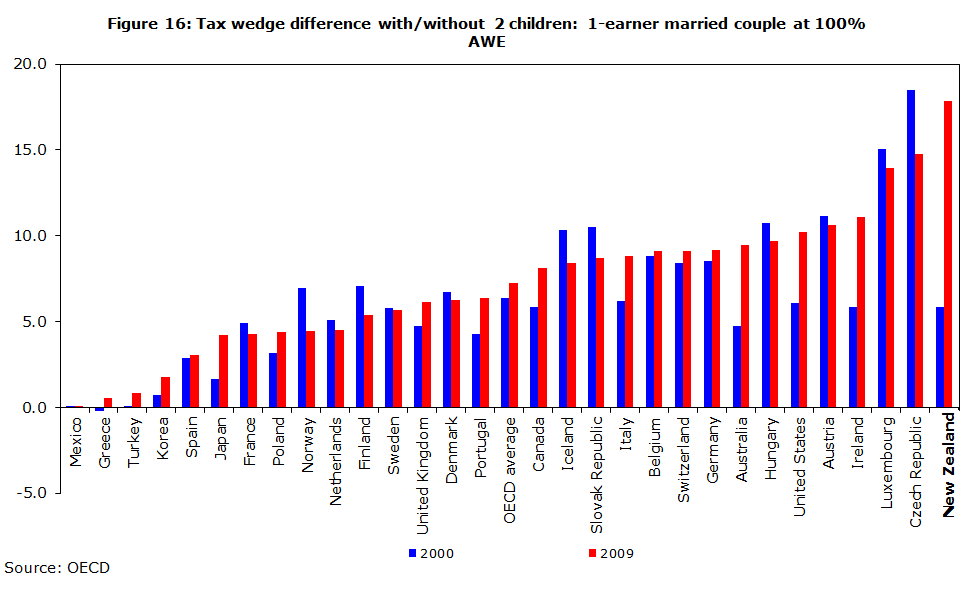
Another example of the redistributive impact of Working for Families is shown in figure 16. It shows the difference between tax wedges for a one-earner household earning 100 percent of AWE with two children and no children. While it is standard for a household with average earnings and two children to be taxed less heavily than a similar household with no children, for New Zealand this difference is greatest. Moreover, in New Zealand there has been a large increase in transfers targeted at households with children as shown by the increase in this difference since 2000.
Importance of Working for Families
From the above information, it should be no surprise that Working for Families is an important source of income for families with children. Working for Families payments can be very large in dollar terms and are paid to thousands of households. Any reforms could therefore have considerable impact.
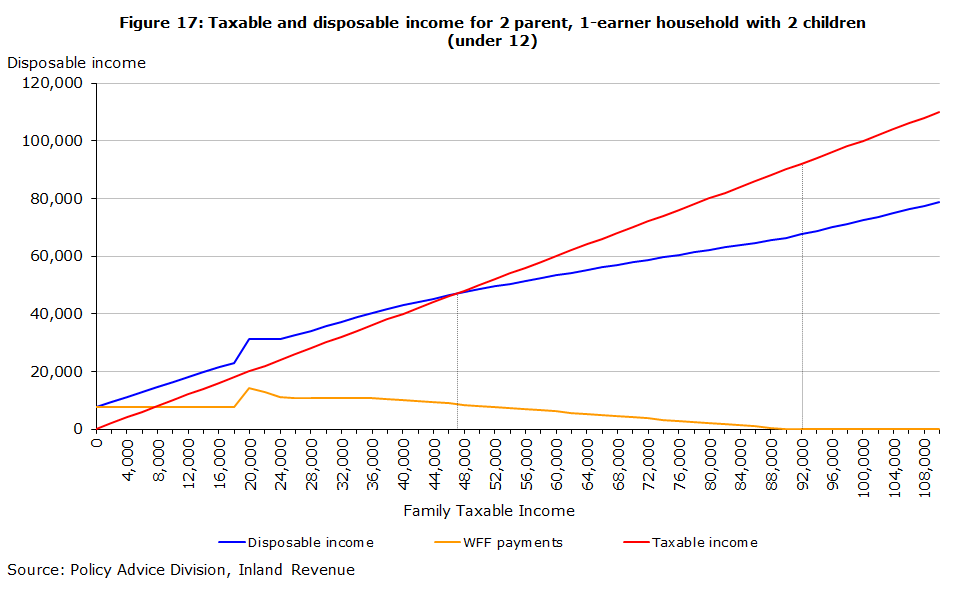
In the 2010–11 year, Working for Families payments were on average $6,643 per recipient household. These payments can make up a large portion of a household’s income. For example, for 81,500 non-beneficiary households, Working for Families payments made up 20 percent or more of their disposable income in 2010–11. Including beneficiary households increases this number to around 210,000.[10] The effects of Working for Families are shown in figure 17 for a two-parent household with two children under 12.
Figure 17 also shows how much net tax a one-earner household with two children pays. Until such a household earns roughly $47,500, it receives more from Working for Families than it pays in tax – that is, it has a negative net tax bill. Working for Families payments fully abate at $92,000 of income, at which point such a household is paying tax of about $24,500 and has disposable income of about $67,500.
Working for Families and work incentives
Working for Families has two significant effects on work incentives. A large portion of the payments are only available to those in work for a reasonable number of hours a week. For households where neither parent works, this provides a strong incentive to seek employment. However, the abatement of payments as family incomes increase can raise “effective” marginal tax rates (EMTRs). That is, for every extra dollar earned, a large portion is lost due to tax or reduced entitlements to Working for Families. Figure 18 shows, for example, that a one-earner couple with one child earning $55,000 faces an EMTR of 53%. A $1 pay rise will therefore provide a $0.47 increase in disposable income.
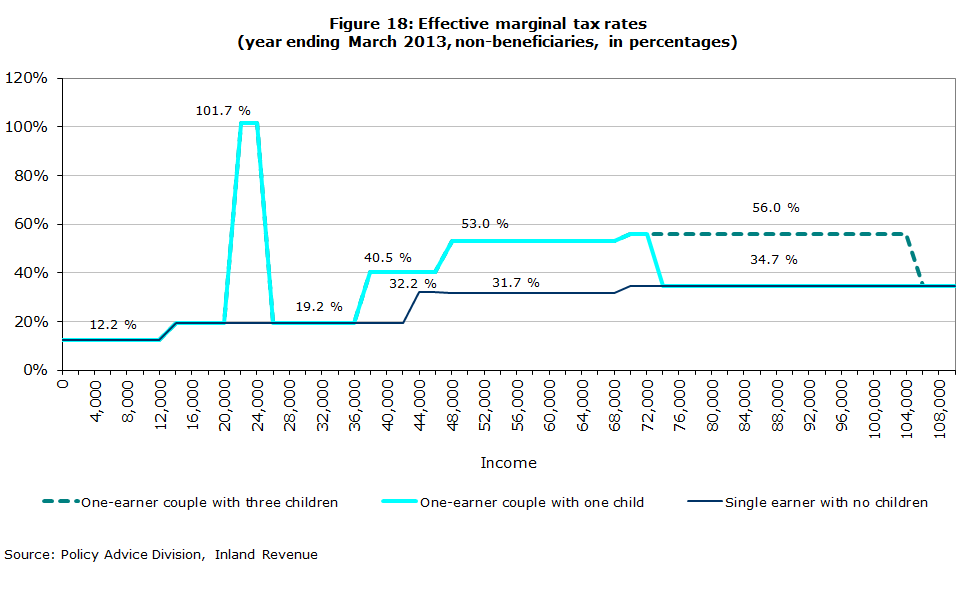
High EMTRs can significantly reduce incentives to work harder or engage in additional training, as large increases in before-tax earnings translate into only small increases in disposable income. This limits the ability of households to take initiatives to change their circumstances. There are no easy solutions to this problem. Reducing high EMTR rates either requires providing less assistance or involves abating social benefits more slowly, which could be costly. Thus, there is an unavoidable trade-off between keeping costs to a minimum in delivering desired levels of assistance to low-income families and work incentives.
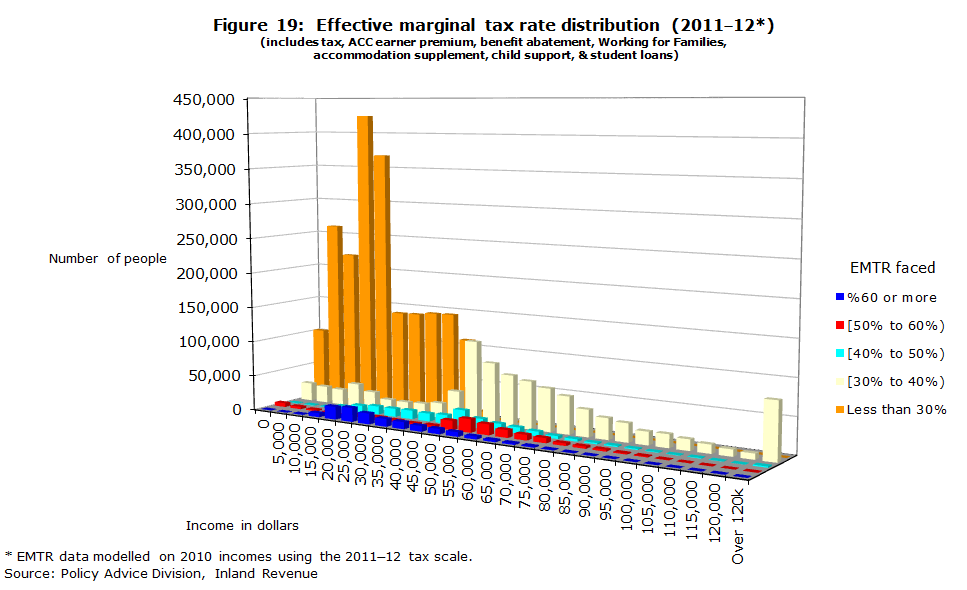
Although some taxpayers do face high EMTRs, they are few in number. Estimates for the year ending 31 March 2012 are shown in figure 19. The figure shows EMTRs taking into account tax and ACC earner premiums, abatement of benefits, the accommodation supplement, Working for Families and also including child support and student loan payments but not childcare subsidies or student allowance abatement on parental income. It is an open question whether child support (which is meeting a parental obligation) and student loan payments (which reduce a student’s future liability) should be seen as equivalent to taxes so the information shown in figure 19 is likely to be a “worst case” scenario.[11]
At present there are 3.38 million individual taxpayers in total. Of these, about 120,000 (3.4 percent) face EMTRs over 60%, 120,000 (3.4 percent) face EMTRs between 50% and 60%, and 160,000 (4.5 percent) face EMTRs between 40% and 50%. Slightly more than 88 percent of taxpayers face EMTRs below 40%. Thus, while EMTRs are very high for some, it is a relatively small percentage of the population. If the payment of child support and student loans is excluded when calculating EMTRs, over 92 percent face EMTRs that are below 40%.
1 Note that some countries, such as New Zealand, tax welfare payments while others do not. This can create apparent differences in tax collected as a percent of GDP.
2 The actual figure reported in the previous BIM was 36 percent. The OECD has since revised the figure for the 2007–08 year to 35.1 percent.
3 The data for New Zealand reflect the year to 30 June 2010. The recent reduction in income tax rates and the increase in the GST rate that were made as part of Budget 2010 will have moved New Zealand away from taxes on income and profits towards consumption taxation relative to data reported in figure 5.
4 If an individual benefits directly from his or her own social security contributions, these taxes may be less distorting than taxes on labour income.
5 Exactly where to group different taxes is not clearcut. A GST also reduces the purchasing power of wages and largely falls on labour income. However, it also reduces the purchasing power of wealth at the time the tax is introduced and is, in part, a lump sum tax on wealth.
6 This is similar to the 9 percent of GDP figure reported for 2006–07 in our last BIM.
7 The top personal tax rate was lowered to 33% as part of the 2010 Budget.
8 De Mooij, R . and S. Ederveen (2005), “Explaining the variation in empirical estimates of tax elasticities of foreign direct investment”, Tinbergen Institute Discussion Paper 108/3.
9 It should be noted that the OECD provides an important warning about using this graph. A low cost does not necessarily mean a high level of efficiency. It could also mean that a country could be doing little to collect taxes that are legally due.
10 In this calculation a household is considered a beneficiary household if it received any amount of beneficiary income during the year.
11 Because student loans are interest-free, there will be some element of “tax” in required payments.