Chapter 3 - Expenditure for raising children
This chapter outlines Australian and New Zealand studies relating to the expenditure for raising children and discusses the implication of these studies for the child support formula. It concludes that the trends in the estimated expenditure for raising children in New Zealand are broadly in line with Australian findings, and suggests that these expenditures should be recognised in any revised formula. A number of related matters are also discussed.
Relevance of the expenditure for raising children
3.1 There is an acceptance internationally that child support contributions should reflect the cost to parents of raising children. Various methods are used to try to achieve this. They invariably involve deriving a “cost” and then translating it into a percentage of income to represent the assumed expenditure for raising a child for a particular income level or range.
3.2 New Zealand’s current scheme is based on an approach initially developed in the United States in the early 1980s as a way to recover from paying parents welfare payments made to receiving parents.[8] Like other schemes internationally, it incorporates a measure of the expenditure for raising children to derive the income percentages used in its formula.
3.3 As noted earlier, a commonly raised criticism of the current scheme – and in particular its formula – is that it may not accurately reflect the expenditure for raising children in varying family circumstances.
3.4 This is partly a function of the approach assuming, in the first instance, that:
- the receiving parent cares for the child and does not earn any income outside of the home (the paying parent is therefore assumed to be the sole income earner); and
- the child lives with the receiving parent for the vast majority of the time.
3.5 Adjustments and review mechanisms have been provided to accommodate a wider range of circumstances such as shared care but these have been found lacking. Accordingly, alternative ways of relaxing the assumptions the scheme is currently based on are discussed in subsequent chapters.
3.6 It is important to consider whether the formula produces payments that fairly represent the true expenditure for raising a child even when there is no shared care and the receiving parent has little income. Some mechanism for determining what it costs to raise a child that is a fair reflection or proxy of the actual cost in the majority of circumstances is, therefore, necessary. Accordingly, this chapter examines overseas results in this area and compares them with estimates of the expenditure for raising children in New Zealand, to test their relevance in the New Zealand context.
Measuring the estimated average expenditure for raising children
3.7 Internationally there is a wealth of research into the expenditure for raising children. It often starts with identifying the items that make up cost or expenditure. These are housing costs,[9] energy consumption, food, clothing and footwear, household goods and services,[10] childcare, health, transport, leisure,[11] personal care and education. Identifying a dollar amount for each of these items is a more complex exercise, however.
3.8 Matters that need to be taken into account to gauge costs include:
- Which methodology is most appropriate. As described in paragraph 3.10, there are two main methodologies for measuring costs – one based on actual expenditure (as per household survey data) and another that uses a “basket of goods” that a child is considered to need for an acceptable living standard.[12]
- The need to compare like with like. For example, families should have equivalent living standards for comparisons to be valid. Also, when analysing actual expenditures it is necessary to make assumptions about the way in which having a child affects the amount that parents spend on themselves as this is not directly measured in household survey data.
- How to allocate costs of goods and services used collectively by the family, the key ones being housing and transport.
- Whether to take into account the additional duplicate costs that arise when parents live apart. These essentially arise from shared care; for example, an extra bedroom, toys and clothes at the paying parent’s home, and travel. Household survey data will tend to reflect the expenditures of two-parent families.
- The need to reduce expenditures by any tax credits and other similar benefits received as these in effect subsidise the cost to parents.[13]
3.9 Opportunity costs, such as forgone earnings while looking after the children, are often not taken into consideration, partly because they are a non-cash cost and studies generally focus on direct parental expenditure. The expenditure required to enable parents to stay in the workforce, namely the cost of childcare, may be included instead, but there is some debate around how to do this. Parents’ participation in the labour force varies significantly so simply including an average cost of childcare within expenditure for raising children estimates could overstate the aggregate costs for those who do not incur childcare and understate the cost for those who, even after allowing for Government subsidies, may have substantial childcare costs.[14]
Methodologies
3.10 While there is a range of approaches to measuring expenditure, the two main methods are:
- Analysing actual household expenditure data to estimate how children add to a couple’s observed household expenditure. Households with the equivalent standard of living, with and without children, are compared under this approach.
- Calculating how much it costs two-parent households to meet the non-discretionary financial needs of children, holding living standards constant, irrespective of household income. Rather than using actual expenditure data, this approach costs a “basket” of goods and services considered appropriate for the relevant living standard.[15]
3.11 There are supporters and detractors of both approaches and their variants. The consensus internationally is that there is no single method that is best and that produces an unambiguous “true expenditure” for raising a child. The Australian Ministerial Taskforce on Child Support undertook one of the most comprehensive studies of this area and concluded that, in the end, it is a matter of judgement, and that judgement must be informed by existing empirical estimates and be evidence-based.[16]
Australian studies and results
Key findings
3.12 The Australian Taskforce took the view that the formula percentages should be based on the best available estimates of the expenditure for raising children. It considered the fairest basis for the scheme to be the expenditure for raising children in two-parent families, with the research on the expenditure for raising children in separated families informing the issue of how to take account of the costs of regular and shared care.
3.13 The taskforce compared the results of various methodologies to reach what it considered to be the best and most up-to-date estimates of the expenditures for raising children in two-parent Australian families. In one study, the Australian Household Expenditure Survey was used to derive patterns of expenditure on children while another study used the basket of goods approach, taking into account differences in housing costs across Australia. The results of these two studies were then compared with earlier Australian research findings on the expenditure for raising children. The Australian estimates were also benchmarked against international studies on the expenditure for raising children.
3.14 The key findings of this research were:
- The dollar cost of raising children increases with family income but declines as a proportion of income.
- The expenditure for raising children rises with the age of the children (teenagers were found to cost two to three times as much as very young children).
- There are economies of scale so that, in general, each additional child costs less than the last.
- Subsidies delivered through the tax system mean that the community as a whole now plays a much more substantial role in sharing the expenditure for raising children for all types of families.
3.15 Some key results from the study undertaken by Paul Henman of the University of Queensland, using a basket of goods to derive estimated expenditure for raising a child for various family situations, are provided in Table 1. The results are reported as percentages of taxable income and, given as noted earlier that childcare costs can vary appreciably depending on a parent’s participation in the workforce, are shown with and without the costs of childcare.
| Household type | Percentage of taxable income | |
|---|---|---|
| With childcare+ | Without childcare | |
| 3 year old | ||
| Modest, both parents full-time employed | 38.5 | 13.1 |
| Modest, one parent full-time employed | 24.6 | 22.4 |
| Low cost, one parent full-time employed | 23.3 | 23.3 |
| 6 year old | ||
| Modest, both parents full-time employed | 24.9 | 17.0 |
| Modest, one parent full-time employed | 16.6 | 16.6 |
| Low cost, one parent full-time employed | 25.4 | 25.4 |
| 10 year old | ||
| Modest, both parents full-time employed | 26.5 | 19.1 |
| Modest, one parent full-time employed | 18.7 | 18.7 |
| Low cost, one parent full-time employed | 27.5 | 27.5 |
| 14 year old | ||
| Modest, both parents full-time employed | 23.9 | 23.9 |
| Modest, one parent full-time employed | 22.0 | 22.0 |
| Low cost, one parent full-time employed | 31.7 | 31.7 |
Where only one parent is full-time employed, the other parent is assumed to be the full-time carer.
+ Childcare costs are gross costs, that is, before receipt of any childcare subsidies.
3.16 Henman also produced dollar expenditure estimates for the main cities in Australia. A modest income two-parent household[17] was found to have spent on average 30 percent more on a child than a low-income family, with annual expenditure, depending on the city, ranging from A$6,500 to A$10,300 compared with A$4,910 to A$7,850 for a low-income family, assuming no childcare costs.
3.17 In contrast, the study undertaken by Richard Percival and Ann Harding of the University of Canberra used actual household survey data to estimate the expenditure for raising children. Some key results are shown in Table 2.
| Level of income | Average weekly income | Number of children in household | |||||||
|---|---|---|---|---|---|---|---|---|---|
| 1 child | % of income | 2 children | % of income | 3 children | % of income | 4 children | % of income | ||
| Low income | $661 | $114 | 17 | $209 | 32 | $290 | 44 | $362 | 55 |
| Middle income | $1,330 | $179 | 13 | $317 | 24 | $428 | 32 | $522 | 39 |
| High income | $2,662 | $285 | 11 | $492 | 18 | $651 | 24 | $779 | 29 |
| Average income | $1,473 | $188 | $331 | $446 | $543 | ||||
Based on Australian Bureau of Statistics 1998–99 Household Expenditure Survey. Calculations do not include childcare costs.
Additional expenditure for raising children when parents live apart and care is shared
3.18 There is general agreement that the costs associated with shared care of a child are higher than when one parent has sole care. The major cause is the need to duplicate housing and related costs, such as utilities, household furnishings, play and study space, toys and play equipment, and additional transport costs.
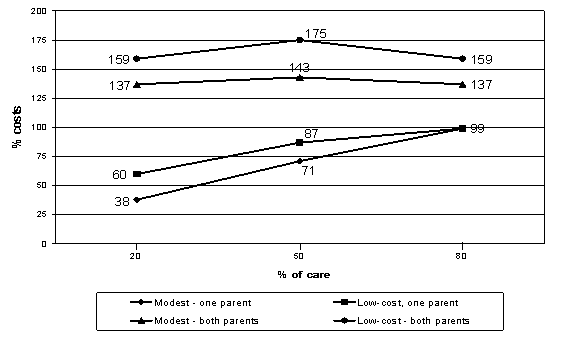
3.19 The Australian Taskforce research has helped to throw light on the extent of these additional costs. The research by Henman found that for households with a modest but adequate living standard, a paying parent with 20 percent care of a six year old child has average costs that amount to 38 percent of the expenditure for a child that is 100 percent cared for by a sole parent.[18] On the other hand, the receiving parent with 80 percent care still incurs 99 percent of the costs he or she would have borne had that parent been caring for the child 100 percent of the time. Aggregate costs are therefore on average 37 percent more under this shared care scenario.
3.20 For the equivalent low-cost household, when 20 percent contact occurs the paying parent faces average costs that are 60 percent of the cost of raising a child in one household and the receiving parent still faces 99 percent of the costs associated with 100 percent care. In aggregate, the cost is 59 percent greater than under the one-household scenario.
3.21 This increase in costs is also evident when care is evenly shared. For modest but adequate households, the costs borne by each parent with 50 percent care represent around 71 percent of the costs borne when all the care is provided by one parent, equating to an aggregate cost of 143 percent. For low-cost households, the equivalent percentages are around 87 percent for each parent and 175 percent in aggregate.
3.22 These findings are illustrated in Figure 1.
Figure 1: Estimated average shared care costs as proportion of 100 percent care situation in Australia
3.23 Table 3 shows how the aggregate costs are distributed among the two parents:
| % of shared care | Low Cost | Modest | ||
|---|---|---|---|---|
| Receiving parent | Paying parent | Receiving parent | Paying parent | |
| 80:20 | 62 | 38 | 72 | 28 |
| 50:50 | 50 | 50 | 50 | 50 |
3.24 The findings suggest that sizable additional costs arise even when a parent has only a 20 percent share of a child’s care. This implies that the shared care threshold should be substantially lower than the 40 percent of nights currently used.
Net costs
3.25 The expenditure for raising children has always been split between parents and the community, with the latter effectively occurring through taxpayers funding the provision of cash transfers or services used by families with children.
3.26 The Australian Taskforce studies highlighted that these transfers had increased substantially since the Australian Child Support Scheme was introduced in 1988, meaning the community as a whole now plays a much more substantial role in sharing the expenditure for raising children for all types of families, but particularly for lower income families. Because of various tax credits there was, for example, no noted net increase in costs after three children.
3.27 Consequently, the taskforce recommended basing child support liabilities on the contribution parents normally make out of their own earnings towards the expenditure for raising their children in two-parent family situations, rather than on the total costs. Such “net” expenditure for raising children is the gross expenditure for raising children minus the contribution of Government through family tax benefits.
Implications for New Zealand
3.28 Following the Australian approach, two methods have been used to measure the expenditure for raising children in New Zealand for the purposes of this discussion document, based on the costs for two-parent families. The options for handling the additional costs arising from shared care when parents live apart are addressed in the next chapter on regular and shared care.
3.29 The methodology from the equivalent Australian studies into the expenditure for raising children has been used as far as possible, but with New Zealand data. The application of these methodologies in the New Zealand context is discussed in detail in appendix 3. A summary of the results is provided below.
Using actual expenditure survey data
3.30 The first method involves estimating parents’ actual expenditures on their children using data from Statistics New Zealand’s 2006–07 Household Economic Survey (HES). This survey collects detailed information on household income and expenditure as well as demographic information on individuals and households.[19]
3.31 The method requires estimating not only households’ expenditure but also households’ standards of living. Households with the same proportion of expenditure on a set of key expenditure items are assumed to have the same standard of living, irrespective of other differences like the total dollar amount spent on consumption, household size or composition.[20]
3.32 The expenditure for a single child can then be measured by the difference in expenditures of a couple-only household and a two-parent household with a child, where both households have the same standard of living. Similarly, the expenditure for raising a second child can be measured by the differences in expenditures of a two-parent household with one child and a two-parent household with two children. Given that child support is potentially payable until a child reaches 19 years of age, the expenditure for raising children is defined as parental expenditures on children up to that age.
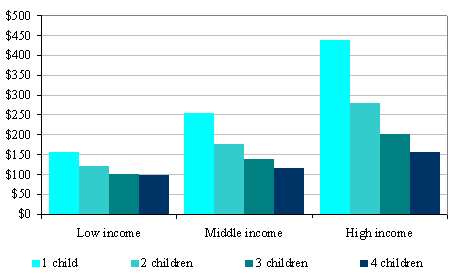
3.33 The results show that the average expenditure for raising children in New Zealand varies according to the age of the child, households’ level of income and the number of children in the household. Higher income households are found to spend more on their children than lower income households, but the proportion of household income spent is lower, particularly for children aged 13 to 18 years. The average expenditure per child is greatest for households with one child and progressively declines with additional children. Moreover, the expenditure for raising children aged 12 years and under is lower than that of teenagers. These findings are shown in Table 4 and Figures 2 and 3, with more detail being provided in appendix 3. The results are all consistent with the findings of the Australian studies.
| Level of income | Average weekly income | Age of child | |
|---|---|---|---|
| 0 to 12 | 13 to 18 | ||
| Low income | $704 | $147 | $196 |
| Middle income | $1,365 | $243 | $291 |
| High income | $2,838 | $426 | $477 |
| Average income | $1,552 | $268 | $316 |
Low income households are defined as the bottom one-fifth of households with children, middle income households the middle one-fifth and high income households the highest income one-fifth.
The reference to “average” in this Table and in Figures 2 and 3 relates to the average for the income band.
Figure 2: Estimated average weekly expenditure for raising one child as a proportion of households’ weekly income (in percentages)
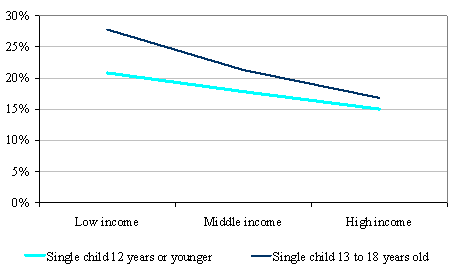
Figure 3: Estimated average estimated weekly expenditure for raising the first, second, third and fourth child
Basket of goods results
3.34 The second method involved estimating the expenditure for raising children through pricing a basket of goods and services considered necessary for raising children at a given living standard.
3.35 An estimate of weekly household expenditure was made for a modest income household with two children – a 14 year old boy and a 6 year old girl. One parent was assumed to be employed full-time, with the other parent being the primary caregiver.
3.36 This estimate for one family type only was done as an accuracy check on the estimated expenditure for raising children calculated from the expenditure approach using the HES data. It was not intended to use the basket of goods approach more widely to try to replicate the trends observed from using actual expenditure data across a range of incomes. This is because the preferred method was the expenditure approach, which bases the expenditure for raising children on parents’ actual expenditure rather than a subjective basket of goods and services considered necessary to provide for children to achieve a given living standard.
3.37 The items, amounts and weightings used in the basket by Henman for a modest income household in Australia were used, as far as possible, to provide direct comparability.[21] For example, when goods or services were used jointly by family members, a portion was allocated to the children in accordance with the weights used in the Australian study. Average retail prices for the basket items were obtained from Statistics New Zealand’s Consumers Price Index data. In some cases, substitute items were used when there was no New Zealand equivalent, because of data confidentiality, for example.
3.38 The modest income household’s total weekly expenditure was estimated to be $1,088 of which $187 was allocated to the 6 year old child and $216 allocated to the 14 year old boy, a total of $403, this being the estimated expenditure for raising the two children. It is broadly in line with the estimate for a similar income household under the other study using HES data (see Figure 3).[22]
Conclusion
3.39 The estimated average expenditure for raising children as a proportion of income for New Zealand is reasonably in line with the Henman findings (using a basket of goods) but is generally higher than the base estimates obtained in the other Australian study (using HES data) by Percival and Harding. For example, the following table compares the expenditure for a 6 year old, a 10 year old and a 14 year old for a low-income household.
| Australia – Henman study* | Australia – Percival and Harding study | New Zealand cost study | ||
|---|---|---|---|---|
| Modest | Low | |||
| 6 year old | 17% | 25% | 18% | 21% |
| 10 year old | 19% | 28% | 18% | 21% |
| 14 year old | 22% | 32% | 28% | 28% |
* Modest income households are also included given that they seem to fall between low and middle income households in the other two studies.
This comparison excludes very young children and focuses on ages when childcare costs are less of an issue.
3.40 There may be several reasons for the difference:
- The lower level of incomes in New Zealand would suggest that the proportion of income spent on children should be slightly higher given the general finding that the proportion of income spent on children declines as income rises.
- The data set used in the New Zealand estimation is smaller and so may be susceptible to greater variation.
- The underlying Australian HES survey data is around 10 years old so that people’s expenditure mixes may have changed.
- Food and energy costs have increased relative to incomes since the Australian studies were undertaken.
- The New Zealand survey data is likely to include childcare costs for some couples, and possibly education costs. As illustrated in the Australian findings, and in particular Table 1, childcare costs can add significantly to the overall cost, particularly for very young children.
3.41 These variations reinforce the view that, in reality, there is no clear single cost and that a degree of judgement is required. On balance, however, a reasonable conclusion is that the New Zealand results are sufficiently in line with those of the Australian studies to support adopting the Australian approach to recognising the expenditure for raising children in the child support formula. What this might mean in practice is discussed in chapter 6.
3.42 An important point to consider is that the costs included in the child support formula should be net of the average tax benefits likely to be received.
Impact of tax benefits
3.43 As in Australia, the tax benefits provided to New Zealand families have increased substantially since the child support scheme was introduced, and the benefits provided in both countries are not dissimilar. Accordingly, the expenditure for raising children as identified above should be adjusted to reflect the amounts that parents would normally need to pay from their own resources – that is, the aggregate costs less any tax subsidy.
3.44 The main benefits in New Zealand are the family tax credit and the in-work tax credit. The family tax credit is paid to the principal caregiver irrespective of whether the person is working or is a beneficiary. A payment is made for each child – in the one-child scenario this equates to $4,487 per annum if the child is under 16 and $5,198 if the child is 16 or over.
3.45 The in-work tax credit is also paid to the principal caregiver but only if that caregiver or their spouse, civil union or de facto partner works “full-time” and neither receives an income-tested or similar benefit. In most cases the payment is a flat $3,120 per annum.
3.46 Tax credits are abated at 20 cents for every dollar of family income over $36,827.
3.47 A separated parent would not qualify unless he or she was also a principal caregiver, in which case the tax benefits would be shared proportionately, according to the level of care, between the parents.[23]
3.48 Child support receipts may also affect the amount of tax benefits that a parent receives, as child support receipts are included as income when calculating Working for Families Tax Credits. This means that if income, including child support, is in excess of $36,827, then for every additional dollar of child support received, the tax benefits received reduce by 20 cents. Likewise, for every dollar reduction in child support, the tax benefits received increase by 20 cents. Paying parents’ tax benefits may also change if they share care.
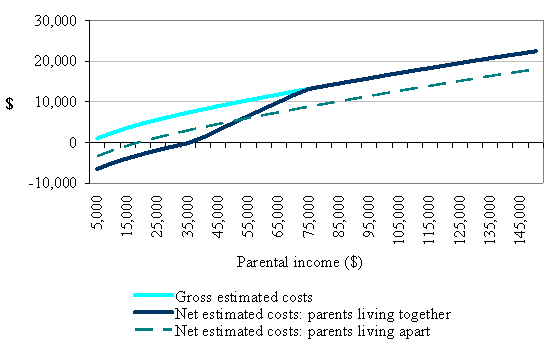
3.49 Figure 4 illustrates one example of the magnitude and spread of costs adjusted for the tax credits. Overall, the outcome will be very dependent on the circumstances of each parent, including the extent to which they participate in the labour force. In the example, however, one parent is the sole income earner and the other parent is the sole care giver for their one child, both when the parents are living together and when they are living apart.
3.50 Under this scenario, when the parents are living together, the family receives both the family tax credit and the in-work tax credit but the abatement applies as the family income rises. The estimated net cost in these circumstances is the solid dark blue line.
3.51 When the parents separate, the receiving parent will continue to be eligible for the family tax credit because his or her income will be less than the abatement threshold of $36,827, irrespective of how much the paying parent earns. However, because of the separation, the receiving parent will not usually be eligible for the in-work tax credit. The estimated net cost in these circumstances is the dotted line.
Figure 4: Estimated expenditure for raising children adjusted for tax credits: one child under 12 years
3.52 Rather than endeavouring to build into the child support formula an adjustment for tax benefits that reflects each parent’s situation, which would unduly complicate the formula, it seems to be more appropriate to follow the Australian approach of reducing the expenditure for raising children percentages for each income band by the average tax benefits likely to be received. This means that the expenditure for raising children matrix shown in Table 10 (chapter 6) is net of likely average tax benefits.
8 The scheme originated in Wisconsin and formed the basis of the scheme previously adopted by Australia too.
9 Because of the variability of housing and the fact that the costs of home ownership, such as a mortgage, are used to acquire an asset that adds to wealth, studies may instead use private rents as their cost guide. For example, the study undertaken by Paul Henman for the Australian Ministerial Taskforce on Child Support used median private rents as its guide. Expenditure for the child was based on whether an additional bedroom was required, which depended on the number, age and sex of the children.
10 This includes an assumed reduction in the life of general household appliances and utensils.
11 Includes the cost of toys, books, sporting equipment and outings.
12 Identifying living standards is an issue in itself.
13 Income tax aspects were not taken into account in the Wisconsin model as it was originally intended to apply to income earners paying little or no tax.
14 Australia has endeavoured to provide for childcare and some degree of lost earnings through applying the higher expenditure for raising 5-12 year olds also to 0-4 year olds given that childcare costs are likely to be highest for very young children.
15 This approach has been used as the basis for many child support guidelines in the United States.
16 The National Academy of Sciences Panel on Poverty and Family Assistance in the United States which undertook a major study on how to measure poverty and equivalence scales, came to the same view.
17 Defined to earn in 2004 around A$46,000 per annum when both parents were working full-time.
18 This confirmed earlier research which had shown that paying parents who care for their children for 15 percent to 30 percent of the time incur a relative share of costs in excess of this proportion.
19 For details about the survey see www.stats.govt.nz.
20 Food made at home, non-durable household supplies and services, communication equipment and services and personal care products and services.
21 That basket contained over 700 items.
22 A “modest income” household with a single income earner would appear to fall between a low and middle income household in the HES study. The expenditure for raising children derived from the basket of goods approach is subject to two known biases, which affect the estimates in opposite directions. The basket of goods and services is likely not to have included some necessary items, which will make the estimated expenditure for raising children lower than the actual costs. On the other hand, the estimated costs are also overstated because they use average retail prices. Lower income households are more likely to shop at discount stores and take advantage of sales. The magnitude of these two effects, and hence whether the costs overall are over-estimated or under-estimated, is unknown.
23 Both parents could, however, qualify in full for the in-work tax credit in their own right if they share care. For Working for Families Tax Credits purposes, shared care arises if the parent has the child in his or her care for at least one-third of the year.