Appendix 3: Estimated expenditure for raising children in New Zealand
Estimated expenditure for raising children
This appendix provides more detail on the results from estimating the expenditure for raising children in New Zealand. It is based on a paper, Costs of raising children, by Iris Claus, Geoff Leggett and Xin Wang which was presented at the New Zealand Association of Economists’ 2009 conference in July 2009. For further detail on the data and methodology used, please refer to that paper on www.nzae.org.nz.
Expenditure for a single child
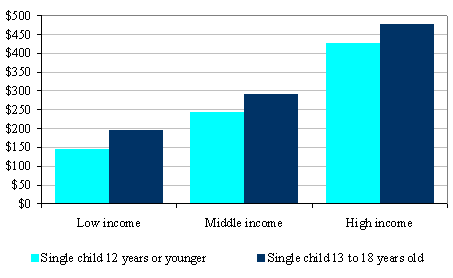
Table 10 and Figure 11 present the average estimated expenditure by households with different incomes on a single child aged 12 years or under, and a child who is 13 to 18 years old.[44] The results show that parental expenditures increase as household incomes rise, with high-income households on average spending more than twice as much on their child than low-income households. The costs of teenagers were found to be higher than those of children 12 years or under. On average, low, middle and high-income households spent respectively 33, 20 and 12 percent more on teenagers than on children aged 12 years old or under.
| Level of income | Average weekly income | Age of child | |
| 0 to 12 | 13 to 18 | ||
| Low income | $704 | $147 | $196 |
| Middle income | $1,365 | $243 | $291 |
| High income | $2,838 | $426 | $477 |
| Average income | $1,552 | $268 | $316 |
Figure 11: Average estimated weekly expenditure for raising a single child
Costs as a proportion of income
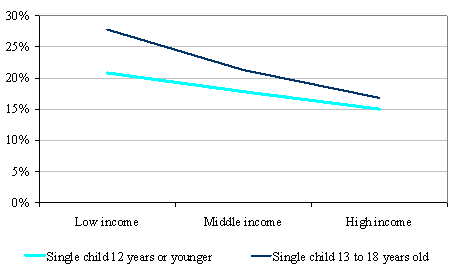
Although the estimated expenditures for raising the child rise with household income, the proportion of income spent on the child was found to decline (see Table 11 and Figure 12). Low-income households spent about 21 percent of their income on a 0 to 12 year old child and 28 percent on a teenager. This compared with, respectively, 15 and 17 percent for a high-income household.
High-income households with a child had on average about four times higher incomes than low-income households but spent less than three times as much as low-income households on a child 12 years or under, and less than two and a half times on a teenager. Also, the proportion of income spent on older children fell faster as income rose than did the proportion of income spent on younger children (falling from 28 to 17 percent compared with a fall from 21 to 15 percent).
| Level of income | Average weekly income | Age of child | |
|---|---|---|---|
| 0 to 12 | 13 to 18 | ||
| Low income | $704 | 21% | 28% |
| Middle income | $1,365 | 18% | 21% |
| High income | $2,838 | 15% | 17% |
| Average income | $1,552 | 17% | 20% |
Figure 12: Average estimated weekly expenditure for raising a single child as a proportion of households’ weekly income (in percentages)
Multiple children
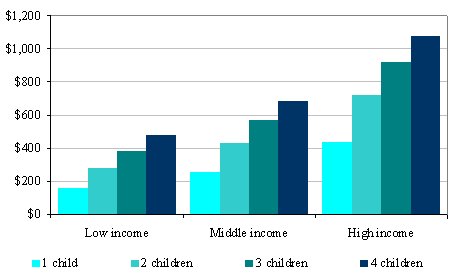
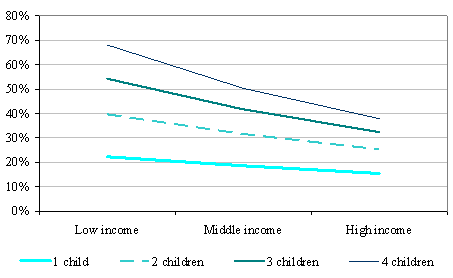
The estimated expenditure for raising children depending on the number of children in the household is reported in Tables 12 to 14 and Figures 13 to 15. These figures represent estimated parental expenditure on children averaged across both age ranges. The results show that estimated parental expenditure increased with the number of children and household income. As with single-child households, the proportion of income spent on children by high-income households was lower than that of low-income households (as shown in Table 13 and Figure 14). It fell from about 40 percent for low-income households with two children to 25 percent for high-income households. For households with four children, the decline in costs was even sharper, from around 68 percent to about 38 percent.
| Level of income | Average weekly income | Number of children in household | |||
|---|---|---|---|---|---|
| 1 child | 2 children | 3 children | 4 children | ||
| Low income | $704 | $157 | $279 | $381 | $479 |
| Middle income | $1,365 | $254 | $431 | $569 | $686 |
| High income | $2,838 | $438 | $718 | $919 | $1,075 |
| Average income | $1,552 | $279 | $471 | $617 | $740 |
Figure 13: Average estimated total weekly expenditure for raising one to four children
| Level of income | Average weekly income | Number of children in household | |||
|---|---|---|---|---|---|
| 1 child | 2 children | 3 children | 4 children | ||
| Low income | $704 | 22% | 40% | 54% | 68% |
| Middle income | $1,365 | 19% | 32% | 42% | 50% |
| High income | $2,838 | 15% | 25% | 32% | 38% |
| Average income | $1,552 | 18% | 30% | 40% | 48% |
Figure 14: Average estimated total weekly expenditure for raising one to four children as a proportion of households’ weekly income (in percentages)
Expenditure for an additional child
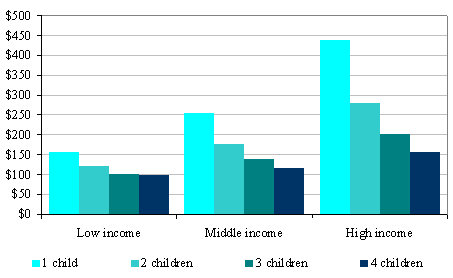
Although the expenditure for raising children rises as the household size increases, the expenditure for raising an additional child is lower than for the previous child or children. This is shown in Table 14 and Figure 15.
For low-income households the expenditure for a second child is about 78 percent of the expenditure for the first child, the expenditure for a third child falls to about 65 percent of the first child, while the expenditure for the fourth child is marginally less at 62 percent.
For high-income households the decline is more dramatic. The expenditure for raising the second, third and fourth child as a proportion of the first child’s costs is, respectively, 64, 46 and 36 percent.
The reductions in the average expenditure for an additional child typically arise from the economies of scale associated with raising more than one child. They may also partly result from income constraints.
| Level of income | Average weekly income | First child | Second child | Third child | Fourth child |
|---|---|---|---|---|---|
| Low income | $704 | $157 | $122 | $102 | $98 |
| Middle income | $1,365 | $254 | $177 | $138 | $117 |
| High income | $2,838 | $438 | $280 | $201 | $156 |
| Average income | $1,552 | $279 | $192 | $146 | $123 |
Figure 15: Average estimated additional weekly expenditure for raising the first, second, third and fourth child
44 The reference to “average” in the tables and figures in this appendix relates to the average for the income band.